Figures & data
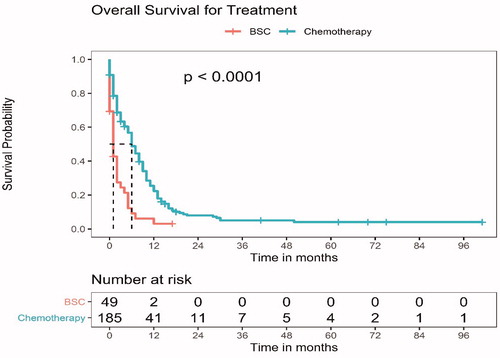
Figure 1. The flowchart of patients evaluated and enrolled on the small cell lung cancer poor performance status observational study.
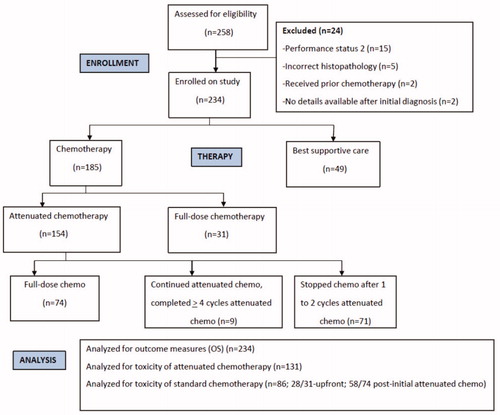
Table 1. Demographic details and baseline disease characteristics of the patients with small cell lung carcinoma who presented with poor performance status.
Table 2. Therapy details of small cell lung cancer patients with poor performance status, i.e. ECOG PS 3 or 4.
Table 3. The demographics and baseline disease characteristics of the patients with small cell lung cancer and poor performance status, grouped according to the initial therapy they received-best supportive care, attenuated chemotherapy, and standard full-dose chemotherapy.
Figure 2. The overall survival (OS) for patients with small cell lung carcinoma and poor performance status (PS 3 or 4), who received any chemotherapy versus best supportive care (BSC). The median OS for the patients who received any chemotherapy was significantly longer at 6 months (95% CI, 4.8–7.2) compared to 1 month (95% CI, 0.4–1.6) in patients who were managed with BSC, p < 0.001; hazard ratio, 0.39 (95% CI, 0.27–0.56).