
Figures & data
Table 1. Demographics of the stage II colon cancer study populations.
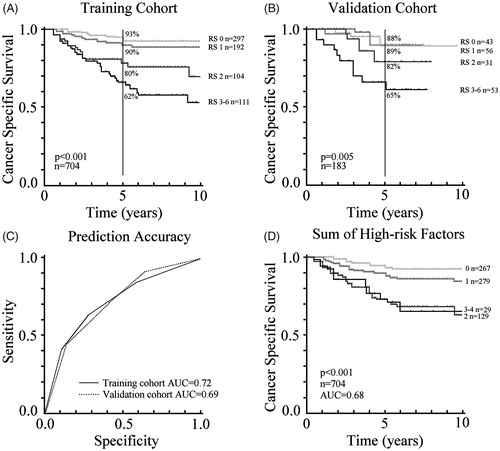
Figure 1. Ten-year cancer-specific survival according to the risk score (RS). (A) Training cohort of 704 patients. (B) Validation cohort of 183 patients. (C) Prediction accuracy of the training and validation cohorts. (D) For comparison, traditional practice using the training cohort, where the number of high-risk factors are added together.
Supplemental material