
Figures & data
Table 1. The OAR dose evaluation matrices.
Figure 1. The color-washed isodose distribution of a representative breast patient planned with (a) RayStation Dose(RBE = 1.1), (b) MCsquare Dose(RBE = 1.1), and (c) LETd-weighted dose. The beam angles of 355 and 325 degrees for this plan are indicated in panel (a). The color-washed LETd is displayed in panel (d). The red contour is the target volume. The dose profiles of the MCsquare Dose(REB = 1.1), the LETd-weighted dose, and the LETd are displayed in panel (e) and the profile line is indicated in panel (d). The DVH is shown in panel (f).
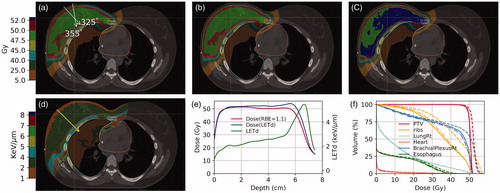
Figure 2. LETd volume histograms on OARs for all 20 patients. The blue and red line represent the population median and mean values, respectively. The shaded bands represent the range of the variation within the 20 patients.
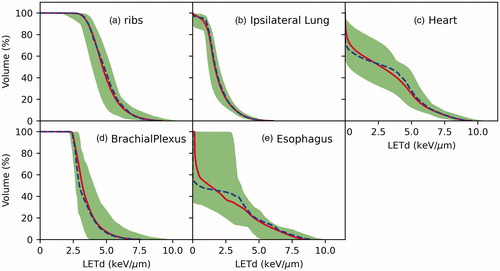
Figure 3. Box plot of the ratio of the Dose(LETd) over the Dose(RBE = 1.1).
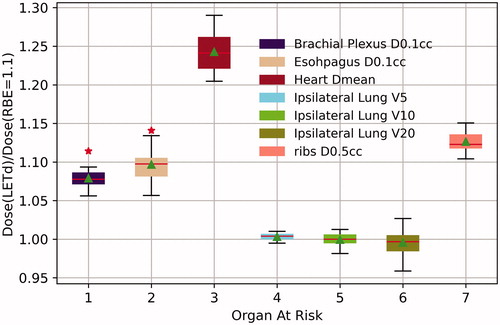
Table 2. The median (range) and mean (SD) of the OAR dose.