Figures & data
Table 1. Patient and treatment characteristics.
Table 2. Trend over time for QLQ-C30, QLQ-BR23 and CTCAE scores.
Figure 1. Changes in QLQ-C30 scores over time after surgery and compared to the Danish general population. The normative data of the reference group were adjusted for different age distributions at each time interval. Absolute effect sizes: white circle: <0.2; black circle: 0.2–0.4; black triangle: >0.4.
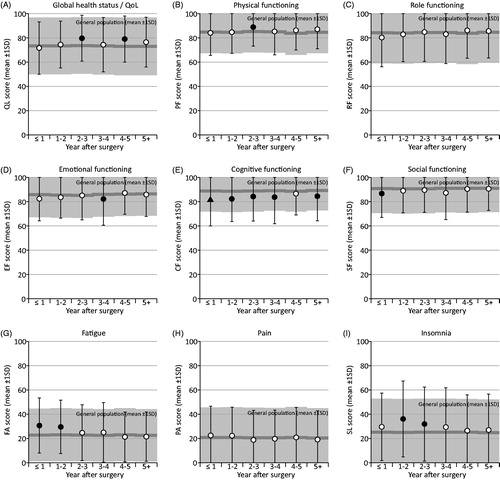
Figure 2. Subgroup analysis of cognitive functioning. The normative data of the reference group were adjusted for different age distributions at each time interval. Absolute effect sizes: circle: <0.4; triangle: >0.4.
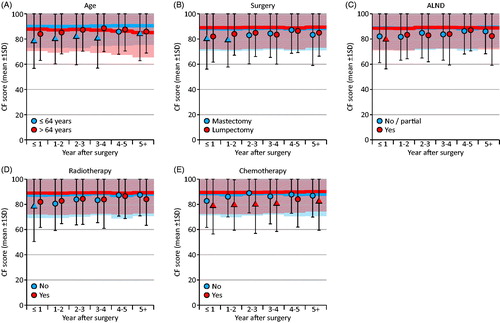
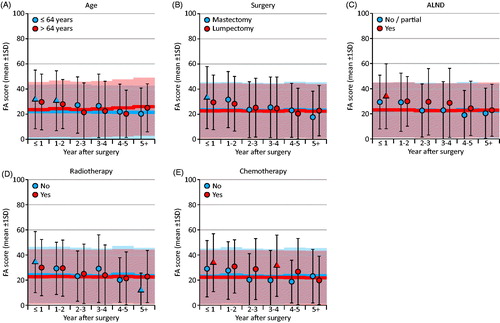
Figure 3. Subgroup analysis of fatigue. The normative data of the reference group were adjusted for different age distributions at each time interval. Absolute effect sizes: circle: <0.4; triangle: >0.4.