
Figures & data
Table 1. Average CCI score at the time of diagnosis and five years after.
Table 2 . The odds ratio of specific comorbidities at the time of diagnosis was calculated for patients with OSCC compared to an age-and sex-matched reference group.
Table 3. The odds ratio of specific comorbidities acquired from the date of the OSCC diagnosis up to five years after the diagnosis date was calculated for patients with OSCC compared to an age-and sex-matched reference group.
Figure 1. Kaplan–Meier survival curves stratified CCI score. (A) 5-year overall survival and (B) Recurrence free survival. *This analysis was not age-adjusted. CCI: Charlson Comorbidity Index.
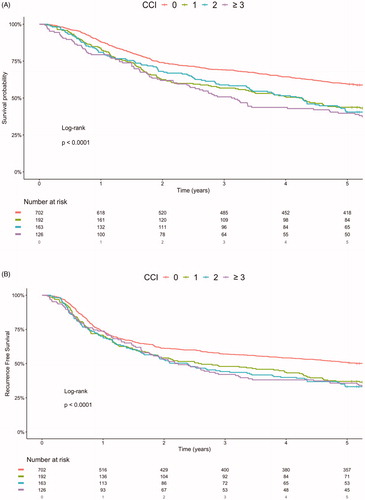
Table 4. Univariate and multivariate analysis of factors affecting overall survival and recurrence free survival -->a.