Figures & data
Figure 1. Measuring the distance (red arrows) from the twelfth thoracic vertebrae to the diaphragm delineated in the scans corresponding to the end of inspiration (orange) and end of expiration (green) breathing phases. Distances were measured in the superior-inferior direction. Off-sets were determined by calculating the difference between the position of the diaphragm in the repeat CT and the planning CT scans.
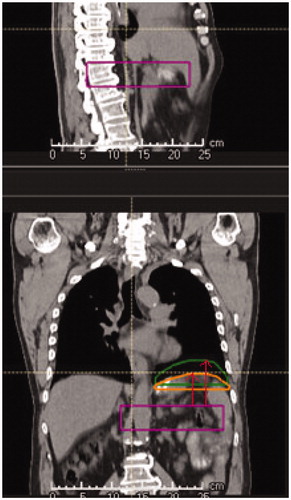
Table 1. Patient characteristics.
Figure 2. (A) Bland-Altman plot showing the changes with respect to the planning CT in distance of diaphragm expiration delineation to TH12 (expiration off-set). (B) Bland-Altman plot of the inspiration off-set. (C) Bland-Altman plot showing the diaphragm amplitude differences with respect to the planning CT.
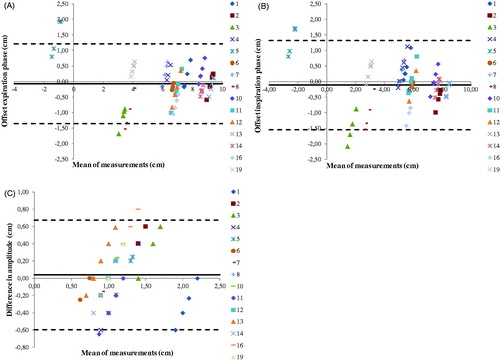
Figure 3. (A) Mean vector length plotted against Diaphragm expiration offset. (B) 95th percentiles of the vector lengths plotted against Diaphragm expiration offset. (C) Mean inferior-superior component plotted against Diaphragm expiration offset.
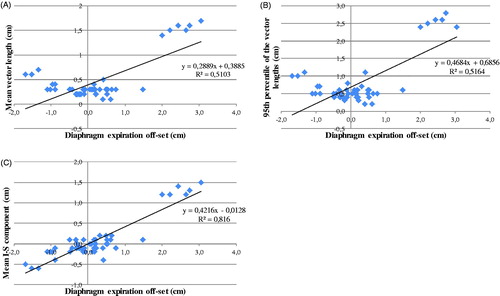
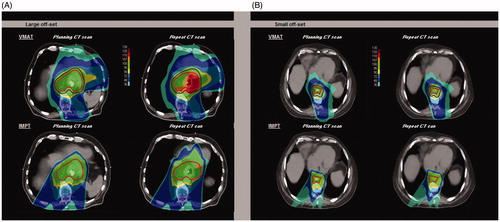
Figure 4. Dose distribution comparison of a VMAT plan with an IMPT plan of a patient with a large diaphragm position off-set (A) and a patient with a small diaphragm position off-set (B). For the VMAT plan, the PTV (dark red) and ITV (red) are shown and for the IMPT plan only the ITV (red) is shown.