Figures & data
Figure 1. Comparison of 4D-ventilation to Q-SPECT. Patients 9 and 25 have had one lung removed. (a) Volume ratios RFL-Q(40%) and RFL-4D(16%) and (b) overlap fraction OFFL-Q(40%)4D(16%) and intersection fraction IFFL-Q(40%)4D(16%). (c) Ratios RFL-Q(1/3) and RFL-4D(1/3), and (d) overlap fraction OFFL-Q(1/3)4D(1/3) and intersection IFFL-Q(1/3)4D(1/3). For some patients with very inhomogeneous functionality, a volume close to 1/3 of the total lung volume was not segmented. The highest volume giving comparable volumes with the two modalities was selected.
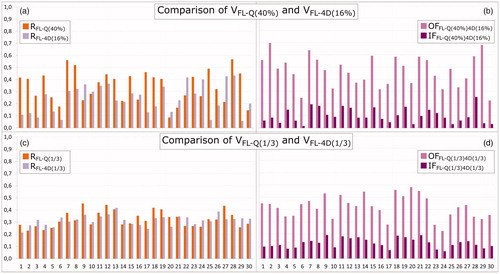
Figure 2. Frontal and transversal planes of (from left to right): AC-CT with Q-SPECT (orange hues), showing values from 0 to maximum counts; 4D-CT with overlay of functional volumes VFL-Q(40%) (orange) and VFL-4D(16%) (light purple), and the overlap between the two (pink); 4D-CT with overlay of functional volumes VFL-Q(1/3) (orange) and VFL-4D(1/3) (light purple), and the overlap between the two volumes (pink); 4D-CT with 4D-CT V-map (rainbow heat map) showing Jacobian values from 1 to maximum value. Primary tumor in red. (a) Patient 2. The cut-off values of 40% for Q-SPECT and 16% for 4D-CT produce volumes of very different size, RFL-Q(40%) is 0.41 and RFL-4D(16%) is 0.12, with OFFL-Q(40%)4D(16%) = 0.70 and IFFL-Q(40%)4D(16%) = 0.09. OFFL-Q(1/3)4D(1/3) is 0.45 and IFFL-Q(1/3)4D(1/3) = 0.10. (b) Patient 20. RFL-Q(40%) is 0.09 and RFL-4D(16%) is 0.13, with OFFL-Q(40%)4D(16%) = 0.37 and IFFL-Q(40%)4D(16%) = 0.03. OFFL-Q(1/3)4D(1/3) = 0.58 and IFFL-Q(1/3)4D(1/3) = 0.15.
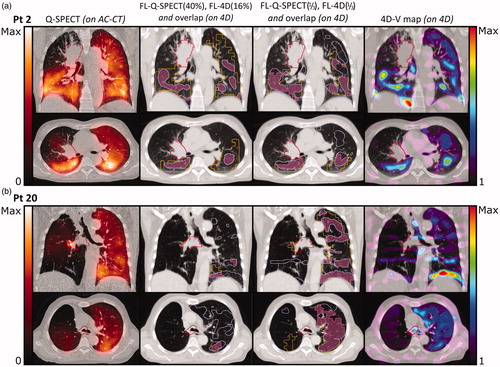
Figure 3. Comparison of 4D-V to V-SPECT. Seventeen patients with a V-SPECT scan are shown (patients 1–4, 6–15, and 19–21). Patient 9 has had one lung removed. (a) Ratios RFL-V(1/3) (cyan) and RFL-4D(1/3) (light purple) and (b) overlap fraction OFFL-V(1/3)4D(1/3) (light blue), and intersection IFFL-V(1/3)4D(1/3) (dark blue).
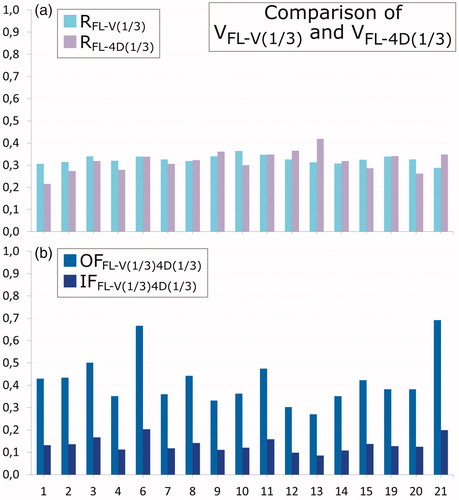
Figure 4. Frontal and transversal planes of (from left to right): AC-CT with V-SPECT (blue hues), showing values from 0 to maximum counts; 4D-CT with overlay of functional volumes VFL-V(1/3) (cyan) and VFL-4D(1/3) (light purple), and the overlap between the two (blue); 4D-CT with 4D-CT V-map (rainbow heat map) showing Jacobian values from 1 to maximum value. Primary tumor in red. (a) Patient 21. OFFL-V(1/3)4D(1/3) is 0.69 and IFFL-Q(1/3)4D(1/3)=0.20. (b) Patient 12. OFFL-V(1/3)4D(1/3) is 0.44 and IFFL-Q(1/3)4D(1/3)=0.14. In both modalities, the functional images have a high level of noise.
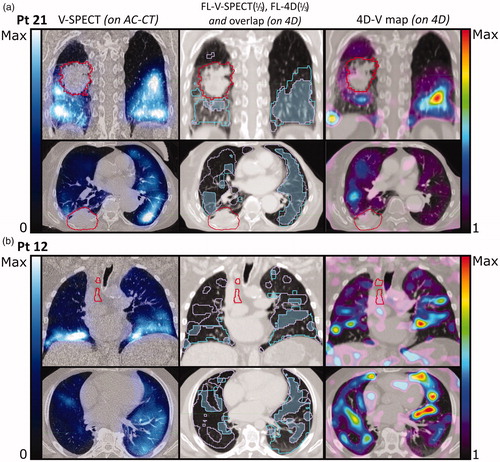
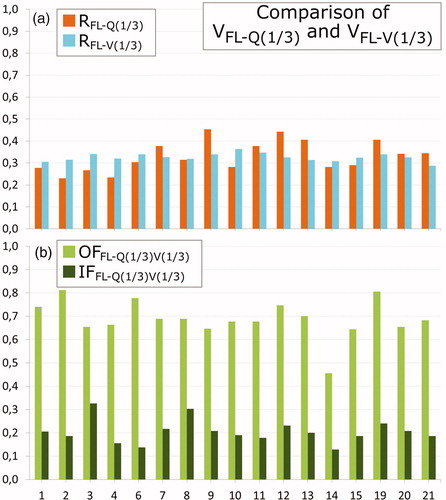
Figure 5. Comparison of Q-SPECT to V-SPECT. Seventeen patients with a V-SPECT scan are shown (patients 1–4, 6–15, and 19–21). Patient 9 has had one lung removed. (a) Ratios RFL-Q(1/3) (orange), RFL-V(1/3) (cyan); (b) overlap fraction OFFL-Q(1/3)V(1/3) (green) and intersection IFFL-Q(1/3)V(1/3) (dark green).