
Figures & data
Figure 1. Selection criteria of the IDH-wildtype glioblastoma patient cohort.
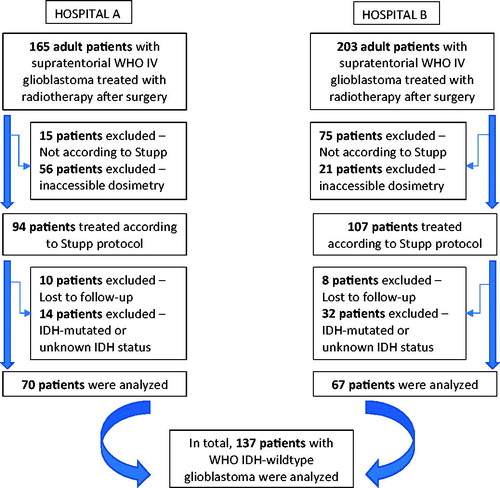
Figure 2. Representative illustration of two-dimension segmentation of the ipsilateral (yellow) and contralateral (orange) subventricular zone on radiotherapy planning CT imaging.
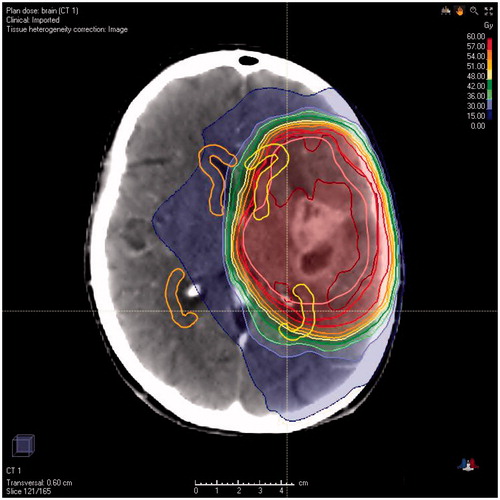
Figure 3. The Kaplan–Meier overall survival curves for IDH-wildtype glioblastoma patients according to methylation status of the MGMT gene promoter.
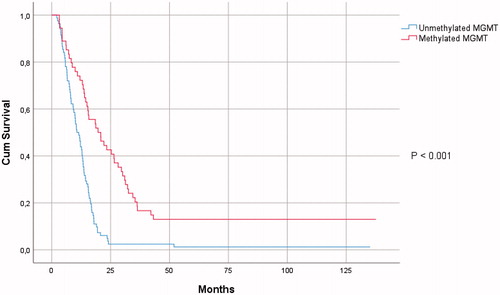
Table 1. Demographical, radiological, molecular and treatment characteristics of 137 IDH-wildtype glioblastoma patients.
Table 2. Univariate survival analysis.
Table 3. Multivariate overall survival analysis model for contralateral subventricular zone mean dose.
Data availability statement
Research data are available on request.