
Figures & data
Table 1. Patient characteristics, pathology, and 18F-EF5 measurements.
Figure 1. 18F-EF5 uptake in prostate cancer. (A) Representative 18F-EF5 PET (left), CT (centre), and merged PET/CT (right) images of three slices from superior (top) to inferior (bottom) through the pelvic region of patient #4 imaged 2 h after 18F-EF5 injection. 18F-EF5 signal in the bladder is indicated by the white arrow; prostate regions are indicated by the dashed circles. (B) Representative 18F-EF5 PET (top), CT (centre), and merged PET/CT (bottom) images from patient #8 taken 2 and 3 h after 18F-EF5 injection.
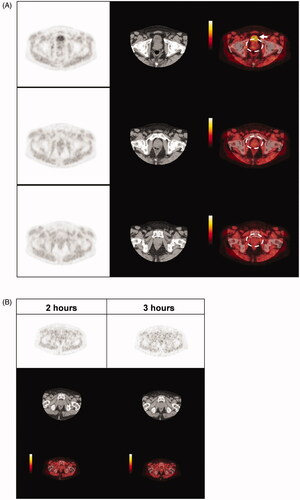
Table 2. 18F-EF5 uptake measured 2 and 3 h post-injection of radiotracer.
Figure 2. Immunohistochemical detection of GLUT1, OPN, and CAIX expression in prostate cancer tissue. (A) Representative images of moderate GLUT1 staining, (B) moderate OPN staining, and (C) negative CAIX staining in serial sections of biopsy ‘a’ from patient #5. Boxed regions in the left images are enlarged on the right. Scale bars = 200 µm (left) or 50 µm (right). (D) Immunoreactive scores (IRS) were calculated for each patient by averaging IRS values for GLUT1, OPN, and CAIX IHC staining from 2 to 3 biopsies per patient. Data are mean ± SD (n = 8, *p < 0.05, ***p < 0.001, Kruskal–Wallis test with Dunn’s post-hoc analysis).
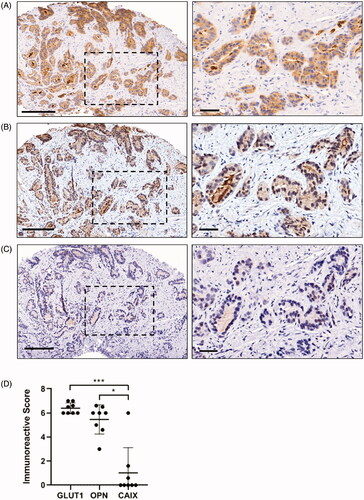
Figure 3. Bland–Altman plots comparing similarities between GLUT1, OPN, and CAIX immunoreactive scores. (A) The difference between GLUT1 IRS values and OPN IRS values within individual biopsies are plotted on the y-axis (closer to zero is more similar) with the average GLUT1/OPN IRS value for the biopsy on the x-axis (higher IRS values indicate more intense and frequent staining). Data points represent individual biopsies (n = 17–22). Dashed line indicates the mean difference between the two markers with 95% CI indicated by the dotted lines; a mean difference close to zero indicates strong agreement between the two markers. (B) GLUT1 IRS compared to CAIX IRS. (C) OPN IRS compared to CAIX IRS.
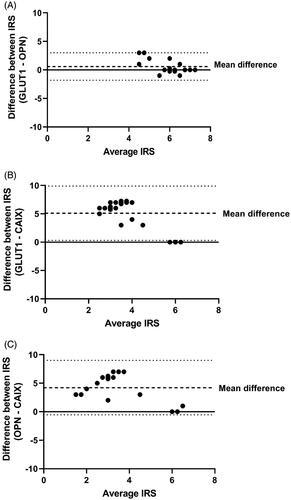
Table 3. GLUT1, OPN, and CAIX IHC scores, Gleason scores, and 18F-EF5 measurements.