Figures & data
Figure 1. Illustration of surface mapping of the inter-observer variation in segmentation. First, as illustrated in (A), the standard deviation (SD) in distance from the different segmentations to a specific segmentation selected as a reference were calculated for each patient and plotted on the surface of the reference contour. Secondly, as illustrated in (B), these patient-specific surfaces of the variation (SD), were transformed to a reference patient allowing the patient-specific surfaces to be plotted on the same surface and allowing for calculation of the SD across patients.
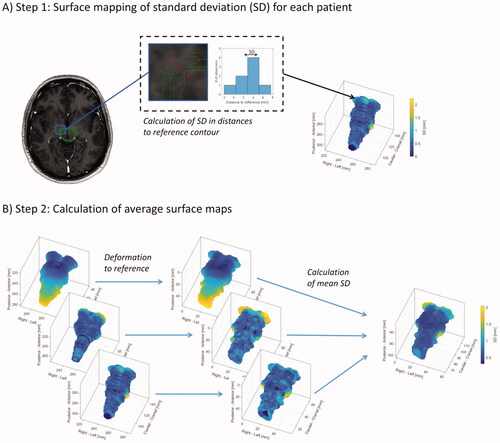
Figure 2. Boxplot of Dice similarity coefficient (Dice) and Mean Surface Distance (MSD) measures for the OAR in the brain. The individual data points indicate each observer’s patient-specific mean measure. Due to large variations in the caudal end of the spinal cord, metrics for the spinal cord are not shown in the boxplot but can be found in .
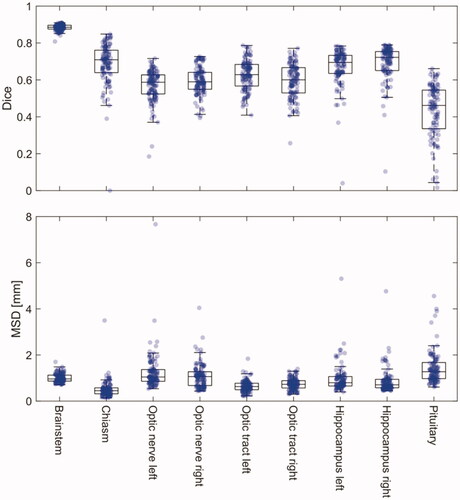
Table 1. Median volumes and comparison metrics with corresponding interquartile ranges shown in parentheses.
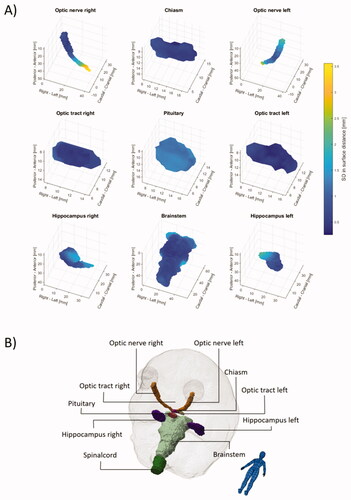
Figure 3. Surface maps of the inter-observer variability given as the mean standard deviation (SD) across the 13 patients are shown in (A). Anatomical directions are illustrated in (B). Due to large variation in the caudal end of the spinal cord maps for the spinal cord is not shown. Individual animated maps can be found in Supplementary figures 1–10.