Figures & data
Table 1. NTCP model predictors and dose constraints from the literature.
Table 2. Patient characteristics for those with (n = 13) and without (n = 32) image changes on the follow-up MRIs.
Figure 1. (a) Example of fixed and variable RBE weighted dose distributions. Note the high dose area in the contoured image change (red line) in the RWDVar dose distributions. (b–c) boxplots of selected dose volume indices for the temporal lobes. RWDFix: dose distribution calculated using a constant RBE of 1.1, RWDMcN: dose distribution calculated using the RBE model from McNamara et al. [Citation6], RWDWed: dose distribution calculated using the RBE model from Wedenberg et al. [Citation7]. CTV 70: prescribed dose 70 GyRBE (RBE = 1.1).
![Figure 1. (a) Example of fixed and variable RBE weighted dose distributions. Note the high dose area in the contoured image change (red line) in the RWDVar dose distributions. (b–c) boxplots of selected dose volume indices for the temporal lobes. RWDFix: dose distribution calculated using a constant RBE of 1.1, RWDMcN: dose distribution calculated using the RBE model from McNamara et al. [Citation6], RWDWed: dose distribution calculated using the RBE model from Wedenberg et al. [Citation7]. CTV 70: prescribed dose 70 GyRBE (RBE = 1.1).](/cms/asset/cc0a5697-cc60-435a-9b22-5fa36512308e/ionc_a_1979248_f0001_c.jpg)
Figure 2. Scatter plot showing the difference in estimated probabilities between RWDFix and RWDVar.

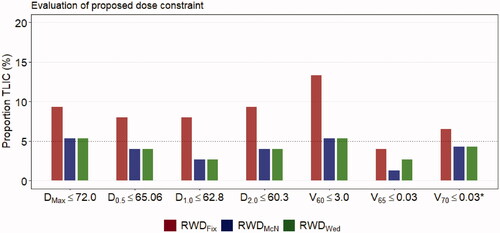
Figure 3. (a) Evaluation of the different dose constraints according to RWDFix, RWDMcN and RWDWed. Barplot of observed proportion of TLIC when the different dose constraints were met. *Dose constraint only evaluated for patients with T3–T4 disease and with skull base/intra cranial involvement. The dotted horizontal line represents the 5% level of observed TLIC in the data set. Dose and volumes in GyRBE and cc, respectively.