
Figures & data
Table 1. Plan and patient details.
Figure 1. (a) The patient (green) in the vacuum cushion fixation (blue) in the breast board (pink). (b and c) Two CT slices from the same patient and treatment plan showing CTV delineations with dose color wash ranging from 50% to 106.4% of prescribed dose. Note that level 1 lymph nodes (yellow delineation) were not a target.
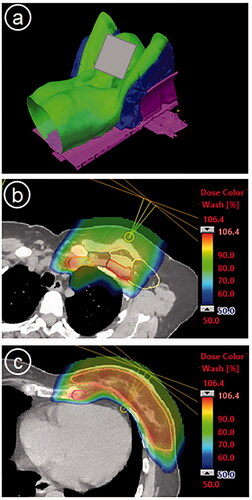
Figure 2. (a) Illustration of the four additional recalculations on artificial CTs and the construction of the structure defining the outer limit tolerance (blue). The dose profiles are extracted along the red arrow and shown in a graph. The black dashed line illustrates the 90% dose level which covers CTVn_IMN. (b and c) show CT and CBCT from a day where the patient was swollen by 5 mm reaching the outer limit structure (pink). The CTVp chest wall contour is red and the CTVn_IMN contour is white.
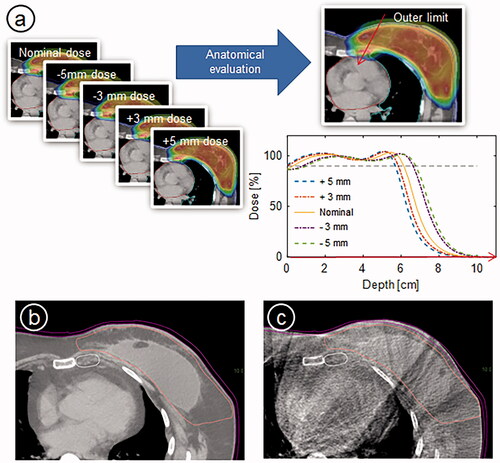
Figure 3. (a–c) Nominal DVH (blue) and DVHs for each of the 14 robust scenarios determined by 0 mm and 5 mm combined with 3.5% range uncertainty for CTVn_IMN, CTVn_periclav and CTVp_breast. The dashed lines indicate the constraint V90%=95% for the CTVn targets and V95%=95% for CTVp_breast. (d) shows the nominal dose coverage and (e) shows the worst-case scenario for the CTVn_IMN with the color wash starting at 90% dose. Note that level 1 lymph nodes (yellow delineation) were not a target.
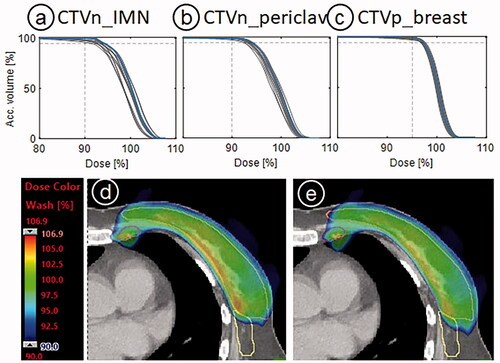
Table 2. The median values and ranges for the target coverage, robust evaluation and anatomical evaluation.