Figures & data
Figure 1. Hematoxylin–eosin (HE) staining’s showing examples of tumors with (A) low level of stromal tumor-infiltrating lymphocytes (TILs) and (B) high level of TILs using a cut off of 30%.
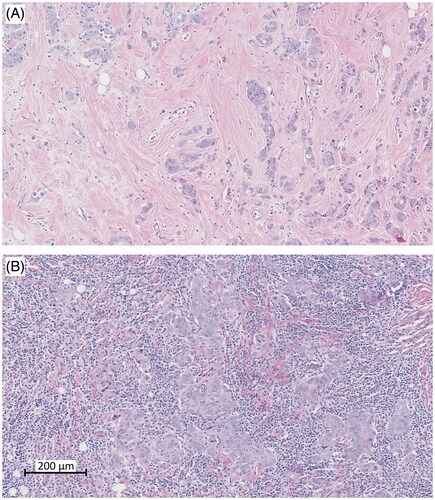
Table 1. Patient characteristics.
Table 2. Uni- and multivariate Cox regression.
Figure 2. Cumulative incidence proportion plots for (A,B) risk of loco-regional recurrence (LRR) and (C,D) risk of distant metastasis (DM) and Kaplan–Meier plots for (E,F) overall survival (OS) for all 1,011 patients divided according to level of tumor-infiltrating lymphocytes (TILs) and stratified according to randomization to post-mastectomy radiotherapy (PMRT) or not (red – PMRT, blue – no PMRT). Actuarial risks at 5, 10 and 20 years and risk difference in actuarial risks at 20 years with 95% confidence intervals are provided, as well as p-values for Log Rank tests for Kaplan–Meier estimates. Interaction tests between TILs and PMRT are stated for both adjusted Cox analysis and risk differences.
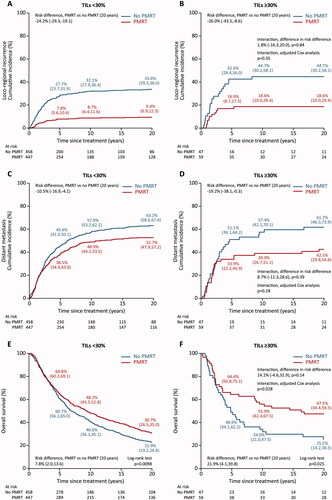
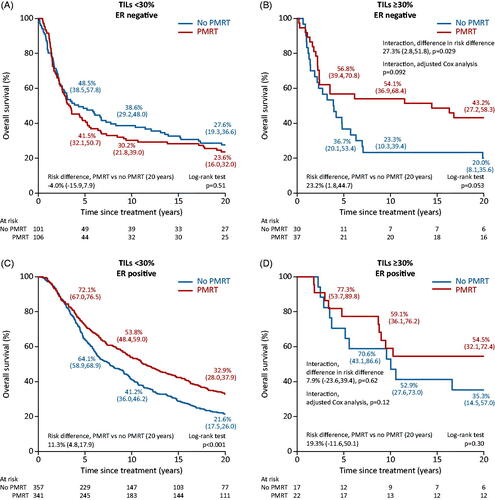
Figure 3. Kaplan–Meier plots for overall survival (OS) for (A,B) estrogen receptor (ER) negative and (C,D) ER-positive tumors divided according to level of tumor-infiltrating lymphocytes (TILs) and stratified according to randomization to post-mastectomy radiotherapy (PMRT) or not (red – PMRT, blue – no PMRT). Actuarial risks at 5, 10 and 20 years and risk difference in actuarial risks at 20 years with 95% confidence intervals are provided, as well as p-values for Log Rank tests and interaction tests between TILs and PMRT (for both adjusted Cox analysis and risk differences).