Figures & data
Table 1. Patient characteristics.
Figure 1. Kaplan–Meier estimates of median overall survival (OS) correlated to start year (panel A) and correlated to first-line therapy (panel B). ICIs: immune checkpoint inhibitors; VEGFR-TKI: vascular endothelial growth factor receptor tyrosine kinase inhibitor; IFN: interferon-alpha.
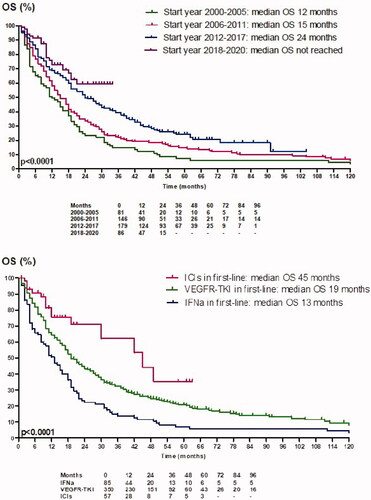
Figure 2. One to five-year survival probabilities depending on start year and availability of treatments (in Belgium). The combination of axitinib/pembrolizumab and axitinib/avelumab became available in 2020.
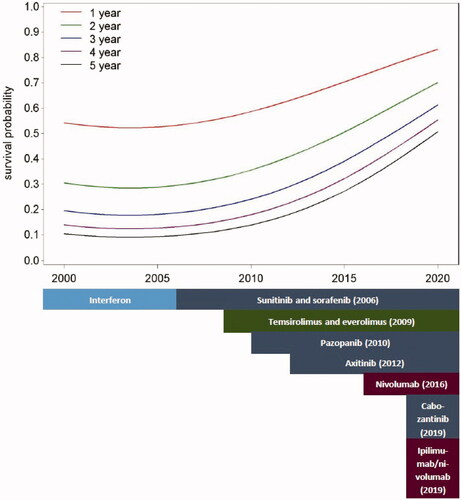
Table 2. One, two, three, four and five-year overall survival depending on starting year and first-line treatment.
Table 3. Univariable and multivariable analysis.
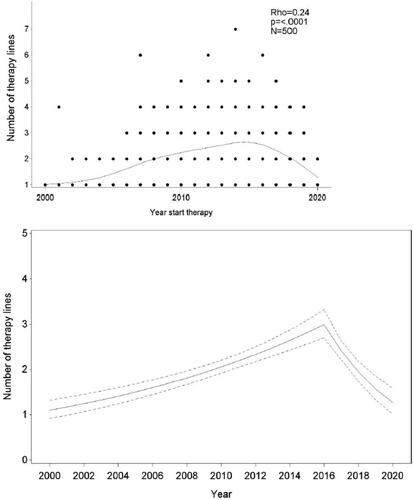
Figure 3. Panels A and B: Number of lines of therapy received by the patients depending on starting year. Panel A: scatter plot with smoothed curve and spearman correlation. Panel B: mean number of lines of therapy over time with 95% confidence interval.