Figures & data
Figure 1. A representative transverse slice of the CT scans acquired on 25th August (A; least pleural effusion), 8th September (B; most pleural effusion) and 2nd October (C; intermediate level of pleural effusion), which served as basis for treatment plans R1/R2A, R2C and R2B, respectively. The deviation of the contours of right lung (purple), CTV elective (red) and CTV boost (orange) with varying positions of the mediastinum can be appreciated.
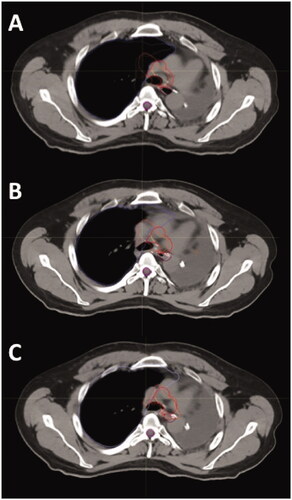
Table 1. Overview of the applied treatment plans and acquired control CT during the course of the plan-library-based plan-of-the-day approach.
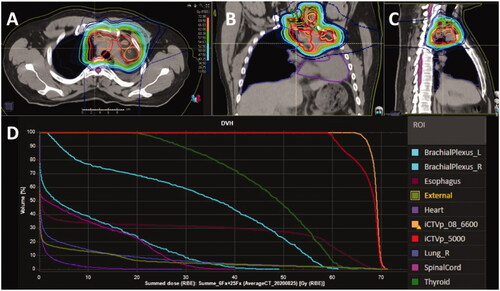
Figure 2. The summed dose distribution of the proton beam treatment plans R1, R2A and R2B covering the high-dose clinical target volume (CTV; iCTVp_08_6600) and the elective CTV (iCTVp_5000) is shown in transverse (A), coronal (B) and sagittal (C) views. The 62 Gy(RBE) isodose line is depicted in orange. The dose-volume histogram for the summed dose is presented in (D).