
Figures & data
Table 1. Sociodemographic and clinical data for the study population at baseline and at the 36 months follow-up.
Figure 1. Description of inclusion, exclusion, and discontinuation of participants in the study.
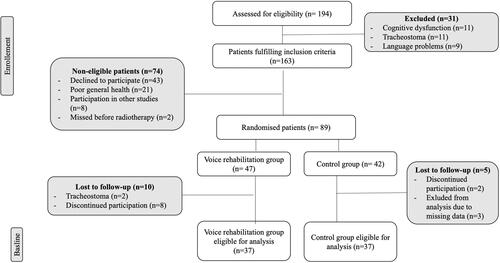
Table 2. S-SECEL scores presented as mean and standard deviation (SD) at baseline, 12 months and 36 months post-radiotherapy for the intervention and control groups.
Table 3. Acoustic and temporal measures presented as mean and standard deviation (SD) at baseline, 12 months and 36 months post-radiotherapy for the control and intervention group.
Table 4. Perceptual evaluation: Changes within the control- and intervention group during the study time-points.