Figures & data
Table 1. Overview of patient and tumor characteristics, and imaging parameters.
Figure 1. Illustration of the experimental procedure. For both cohorts C1 and C2, T2-weighted (T2w) images were available, whereas diffusion weighted images (DWI) were available for C1 only. Manual delineations were made by radiologist 1 (R1) in C1 and radiologist 3 (R3) in C2. For a subset of C1, delineations by radiologist 2 (R2) were also available. The splits of cohort C1 into five cross-validation (CV) folds and a hold-out test set (test) were stratified by T-stage and sex. For those patients where both T2w images and DWI were available a model on both T2w + DWI was evaluated in parallel to the T2w model. The per patient Sørensen Dice similarity coefficient (DSCp) was used to quantify performance when evaluating the predicted segmentations (P).
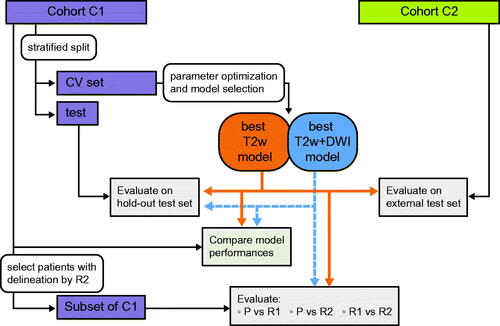
Figure 2. (A) Results of five-fold cross-validation for models trained on T2-weighed (T2w) images alone and in combination with diffusion-weighted imaging (DWI) (T2w + DWI) in cohort C1. Image normalization (Norm) was done by either using the z-score (ZS) or the z-score with histogram matching (ZS + HM). Training parameter options for loss function (DL: dice loss; mDL: modified dice loss) and learning rate (LR) were explored. Median (M) and inter-quartile-range (IQR) of the per patient Sørensen Dice similarity coefficient (DSCp) are listed. The combined box and violin plot shows the DSCp for the combined five folds, with outliers shown as dots. The x marks the median DSCp for the individual folds. The combinations with the highest rank sum are marked with R. (B) Result of post hoc Nemenyi pairwise comparison for the results presented in A. Values above the diagonal (orange) state results for models based on T2w images. Values below the diagonal (blue) give the results for models using T2w + DW images as input.
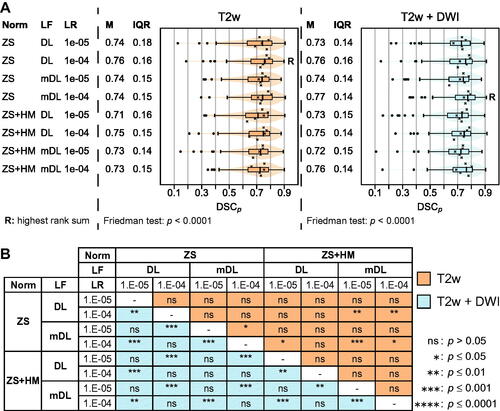
Figure 3. (A) Comparison of the per patient Sørensen Dice similarity coefficient (DSCp) for the five-fold cross-validation (CV) (n = 92) and test set evaluation (majority voting, n = 17) of cohort C1. Median (M) and interquartile range (IQR) are stated. Results are shown for the superior models based on T2-weighted (T2w) and both T2w and diffusion weighted imaging (DWI). For each input set, the model with the highest sum rank in the previous analysis was chosen (T2w: Z-score normalization, Dice loss function, 1e-4 learning rate; T2w + DWI: Z-score normalization, modified Dice loss function, 1e-4 learning rate). (B) Comparison of the DSCp of T2w and T2w + DWI-based models for all patients in C1 (CV and test set) with result of the two-sided Wilcoxon signed rank test. (C) Comparison of the internal and external test set results (DSCp) for the T2w-based model. (Internal: C1-test; External: C2, n = 83). (D) DSCp between predictions (P) on C1 and manual delineations made by radiologist R1, whose delineations were used during the training, and radiologist R2, respectively. C1 patients were restricted to those with two manual delineations (n = 74). For comparison, the interobserver (IO) DSCp is shown for the same set of patients. For both input combinations (T2w, T2w + DWI), two-sided Wilcoxon signed rank test was used to compare the performance that the two radiologists would experience.
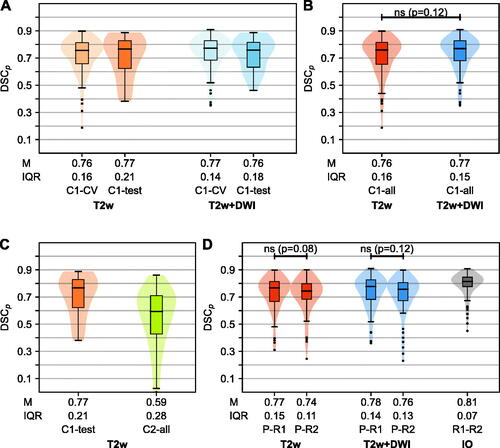
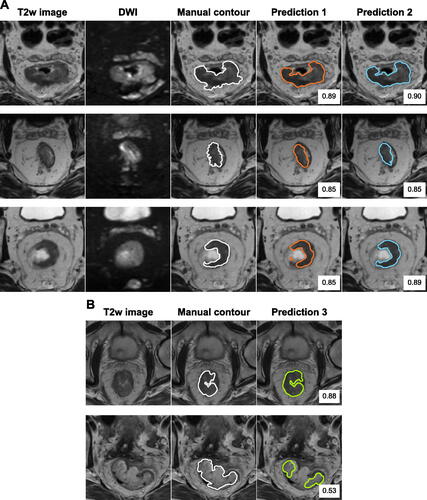
Figure 4. Illustration of predicted contours made by the best models and corresponding DSC value. (A) For three patients in C1, the T2-weighted (T2w) image and the diffusion weighted imaging (DWI) (b = 500s/mm) are shown. Manual delineations by radiologist R1 are shown as contour. Predictions made by the best T2w image-based model (Prediction 1) and the best model using T2w + DWI (Prediction 2) are shown (cf. ). (B) For two patients in C2, the T2w image and manual delineation are shown. The predicted segmentation (Prediction 3) was made using the best T2w-based model trained on C1.