Figures & data
Figure 1. Prevalence of MECOM overexpression gene among pediatric patients with AML.
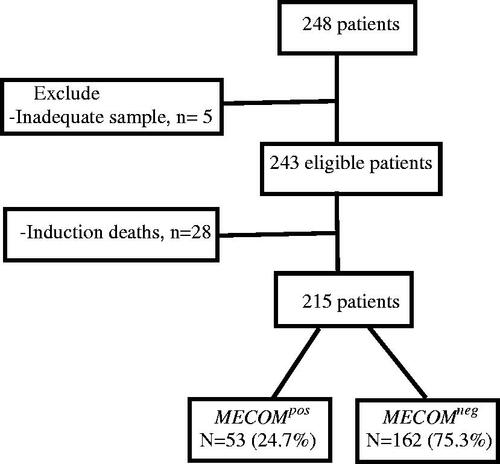
Table 1. Distribution of MECOM gene overexpression depending on patient’s characteristics with multiple hypothesis adjustment.
Figure 2. Impact of MECOM gene overexpression on survival. (A) Kaplan–Meier curves of overall survival of patients with MECOMpos vs MECOMneg among the whole cohort, (B) Kaplan–Meier curves of event-free survival of patients with with MECOMpos vs MECOMneg among the whole cohort, (C) Cumulative incidence of relapse among patients with MECOMpos vs MECOMneg among the whole cohort, (D) Kaplan–Meier curves of overall survival of patients with MECOMpos vs MECOMneg within disease risk group, (E) Kaplan–Meier curves of event-free survival of patients with MECOMpos vs MECOMneg within disease risk group.
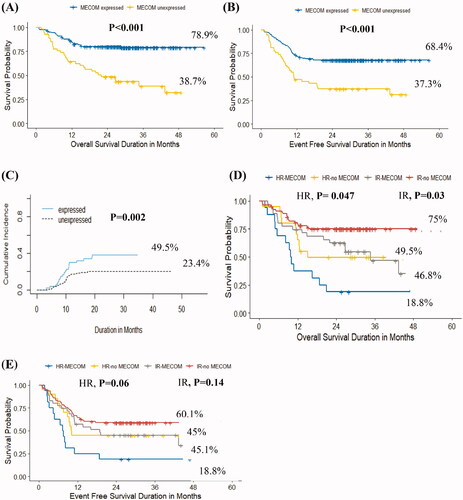
Table 2. Cox regression for univariate and multivariate analyses of MECOM overexpression, FAB, MLL-r, complex karyotype, and initial risk.
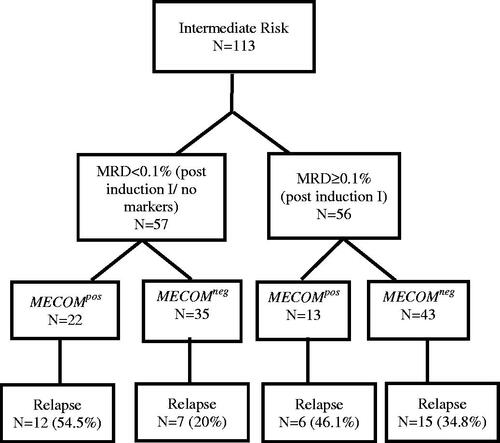
Figure 3. MECOM overexpression among patients in the intermediate risk group.