
Figures & data
Table 1. Patient characteristics.
Figure 1. Treatment response. Bar graph of assessed local response in both study arms. CR: complete response; PR: partial response; SD: stable disease; PD: progressive disease.
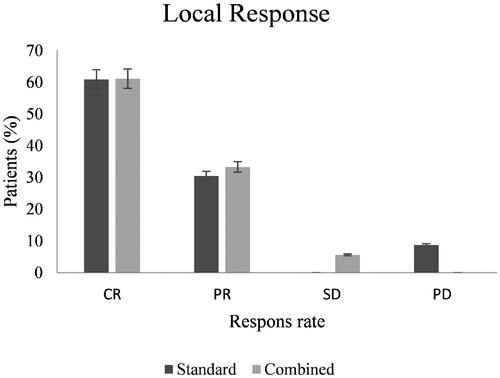
Figure 2. Kaplan–Meijer curves. (A) Kaplan–Meijer curve comparing the overall survival of both study groups. Median survival of both groups depicted in dotted lines. Beneath the Kaplan–Meijer curve the number at risk is described as the number still alive over time in months. (B) Kaplan–Meijer curve comparing the LPFI of both study groups. Beneath the Kaplan–Meijer curve the number at risk is described as the number without local progression over time in months.
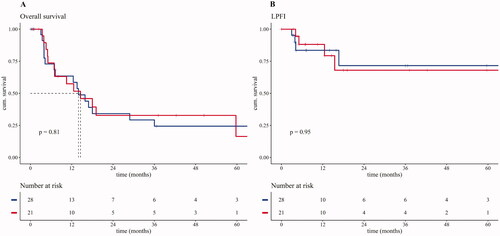
Figure 3. Forest plots of univariate analyses. (A) Forest plot presenting the estimated effect of different variables on overall survival (OS) using the hazard ratio. Variables are shown describing the effect in the cisplatin and the noncisplatin group as well as the combined effect on OS. (B) Forest plot presenting the estimated effect of different variables on local progression-free interval (LPFI) using the hazard ratio. Variables are shown describing the effect in the cisplatin and the non-cisplatin group as well as the combined effect on LPFI.
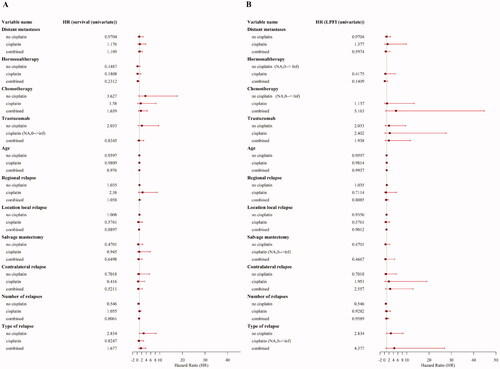
Table 2. Number of patients with high-graded toxicity.