
Figures & data
Figure 1. Flowchart illustrating the selection process of patients from the Copenhagen Oral Cavity Squamous Cell Carcinoma (COrCa) database included in analyses of this study, and reasons for exclusions. ATE: accumulated tobacco exposure.
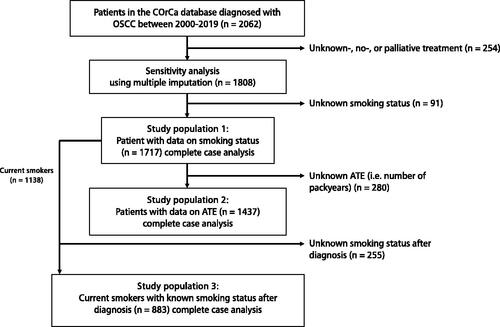
Table 1. Baseline characteristics of the included patients (study population 1) with oral squamous cell carcinoma (OSCC) from the COrCa database diagnosed between 2000–2019 stratified by smoking status: never-, current and former smokers.
Table 2. Multivariable Cox regression analyses adjusted for the below mentioned variables on overall survival (OS) and disease-free survival (DFS) for patients with oral squamous cell carcinoma from the COrCa database.
Figure 2. Kaplan–Meier (KM) curves for overall survival (OS) and disease-free survival (DFS). KM-curves for (A) OS and (B) DFS stratified by smoking status, and (C) OS and (D) DFS stratified by categorical ATE. The 2- and 5-year survival probability (in percent) with 95% confidence intervals are tabulated below.
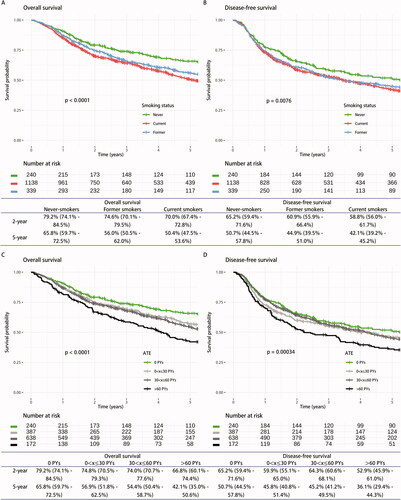
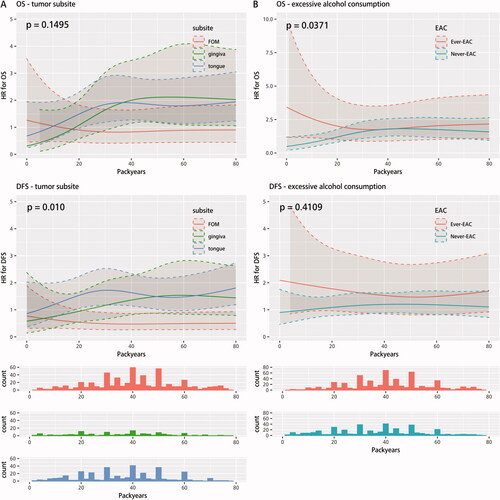
Figure 3. Interaction analyses between smoking history (continuous ATE (i.e. number of PYs) included through a restricted cubic spline model and smoking status (yes/no)) and (A) tumor subsite (FOM, gingiva and oral tongue) and (B) excessive alcohol consumption (ever- and never-EAC) on survival estimates (OS and DFS) adjusted for α: sex, age at diagnosis, year of diagnosis, UICC7 stage, tumor subsite, and alcohol consumption. p-values for heterogeneity between multivariable Cox regression analyses (with and without an interaction term), were placed in the upper left corners of the plots. The patients with 0 Pys are not shown in the histograms. ATE: accumulated tobacco exposure. OS: overall survival; DFS: disease-free survival; FOM: floor of mouth; EAC: excessive alcohol consumption.
Supplemental Material
Download MS Word (21.2 KB)Supplemental Material
Download MS Word (25.4 KB)Supplemental Material
Download MS Word (61.6 KB)Supplemental Material
Download MS Word (39.9 KB)Supplemental Material
Download MS Word (96.4 KB)Supplemental Material
Download MS Word (930.1 KB)Data availability statement
Data are available from the corresponding author upon request, however transfer of data requires specific approval from the Danish authorities.