
Figures & data
Figure 1. Flowchart of the study cohort.
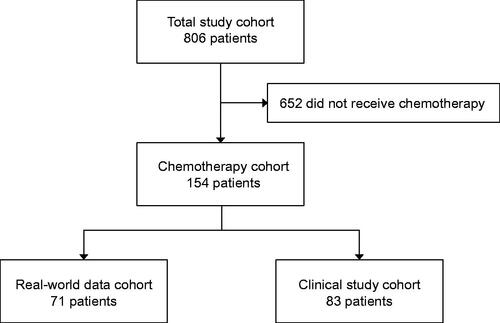
Table 1. Demographic, clinical and histopathological characteristics of patients who received perioperative chemotherapy.
Table 2. A comparison of the demographic, clinical and histopathological characteristics of the RWD cohort and the clinical study cohort.
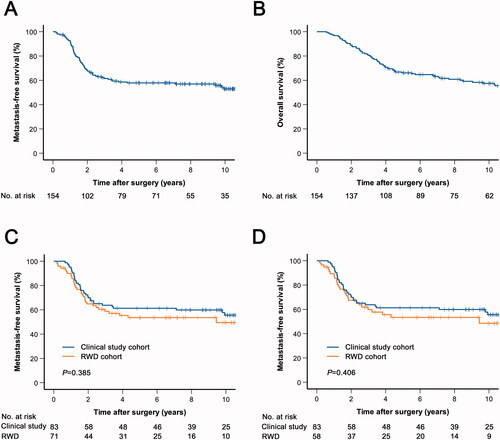
Figure 2. Kaplan-Meier curves of metastasis-free (A, C, D) and overall survival (B) in patients who received perioperative chemotherapy. (A, B) The total chemotherapy cohort. (C) The total chemotherapy cohort was stratified based on whether patients were included in a clinical trial. (D) Patients who received perioperative chemotherapy with doxorubicin and ifosfamide were stratified based on clinical trial inclusion. RWD; real-world data.
Supplemental Material
Download MS Word (17.4 KB)Data availability statement
The data that support the findings of this study are available from the corresponding author (KB) upon reasonable request.