
Figures & data
Figure 1. Results on hypoxia classification of squamous cell carcinoma of the anus (SCCA) tissues using a 15-gene hypoxia classifier. A: Comparison between the mean expression level of each of the 15 genes between the SCCA samples on the x-axis and a representative head and neck squamous cell carcinoma (HNSCC) cohort on the y-axis. B: The sum scores for the 15 genes. A negative score categorises the tumour as less hypoxic, and a positive score categorises the tumour as more hypoxic. Each bar represents a case. For patients with local recurrence, the number of months from the end of treatment to the time for diagnosis of recurrence and tumour characteristics are measured in the table. C: Aalen-Johansen estimated correlation between hypoxia classification and local tumour control.
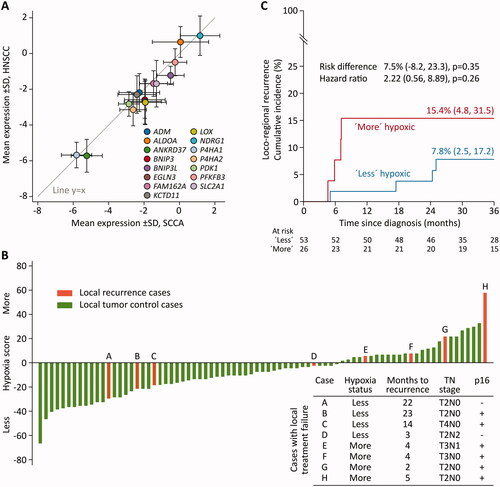
Table 1. Pretreatment Characteristics.
Data availability statement
Data not available due to legal restrictions.