
Figures & data
Figure 1. The relative dose profiles in the anterior-posterior, left-right and inferior-superior directions of the tumor insert for tumors that were irradiated without any tumor motion (blue) and with a tumor motion of 30 mm in the inferior-superior direction (green). The dots and crosses indicate the measured profiles and the lines indicate the calculated profiles. The blue profiles for static tumors were normalized to 1 at the central axis and green profiles for the tumors in motion were normalized according to the corresponding ionization chamber measurements at the central axis.
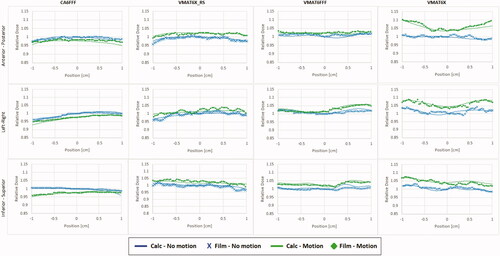
Table 1. The measured and calculated difference of the isocenter dose between the moving and the static tumor.
Figure 2. The relative difference between the simulated delivered dose and the planned dose as a function of tumor motion for (A) D98%, (B) D2% and (C) Dmean for the GTV for all the performed simulations. Negative values indicate that delivering the dose while the tumor is in motion resulted in lower doses to the GTV than if the dose was delivered while the tumor was not moving. The difference in Maxdiff is presented in % of the prescribed dose and separately for the maximum overdosage (D) and maximum underdosage (E).
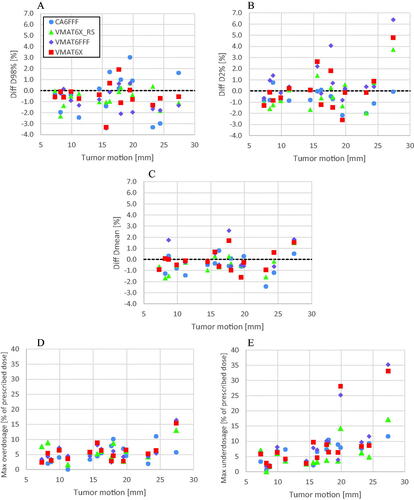
Figure 3. The overall spread of the difference in D98%, D2% and Dmean for tumors moving <15 mm (A) and >15 mm (B) including all different treatment techniques. The points indicate the mean difference, and the error bars indicate the maximum and minimum difference that was observed for each parameter.
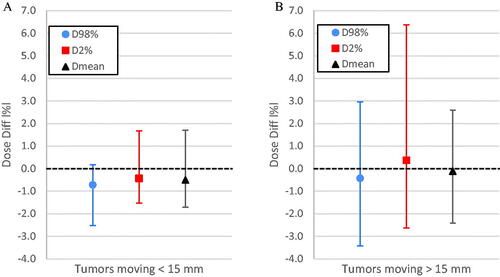
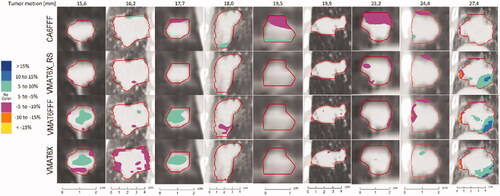
Figure 4. Coronal views showing the dose difference between simulated delivery for tumors in motion and static tumors for all the tumors with motion amplitudes >15 mm. Negative values indicate that delivering the dose while the tumor was moving resulted in lower doses to the region than if the dose was delivered while the tumor was static. The dose differences are presented as % of the prescribed dose. Regions with no color indicate that the dose difference was within ±5%.
Supplemental Material
Download MS Word (37.2 KB)Data availability statement
The data that support the findings of this study are available from the corresponding author upon reasonable request.