
Figures & data
Figure 1. Flowchart depicting included and excluded FACT-P questionnaires. Additional two forms were excluded from the in-group model only due to a missing baseline questionnaire. Arm A: docetaxel 50 mg/m2 every two weeks; Arm B: docetaxel 75 mg/m2 every three weeks.
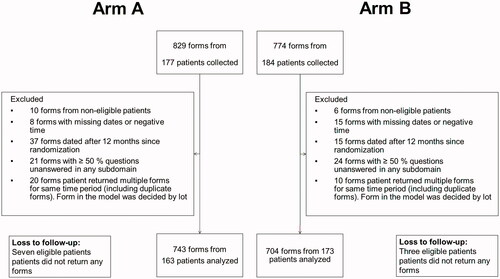
Table 1. Forms by type of the visit for each Arm.
Table 2. Total FACT-P scores compared to the baseline values for months 1 − 7 and directly between groups for months 8 − 12.
Table 3. FAPSI-8 compared to the baseline values for months 1 − 7 and directly between groups for months 8 − 12.
Table 4. Summary of the clinically and statistically significant results from both models.
Supplemental Material
Download MS Word (26 KB)Supplemental Material
Download MS Word (13.8 MB)Data availability statement
The anonymized version of the data presented in this are available on a reasonable request from the corresponding author. The data are not publicly available due to statutory reasons.