
Figures & data
Figure 1. Patient flow chart.
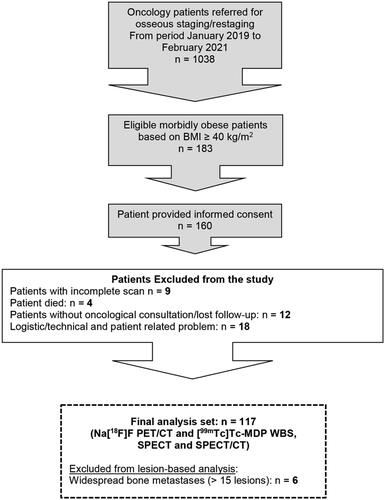
Table 1. Summary of main patient characteristics.
Figure 2. Diagnostic test characteristics of Na[18F]F PET/CT, [99mTc]Tc-MDP WBS, SPECT, and SPECT/CT using a patient and lesion-based optimistic and pessimistic analysis (with 95% confidence intervals).
![Figure 2. Diagnostic test characteristics of Na[18F]F PET/CT, [99mTc]Tc-MDP WBS, SPECT, and SPECT/CT using a patient and lesion-based optimistic and pessimistic analysis (with 95% confidence intervals).](/cms/asset/5c9a374e-082c-48a0-9cf5-a14aef31d64f/ionc_a_2101899_f0002_b.jpg)
Table 2. Pairwise comparison of the diagnostic test characteristics of Na[18F]F-PET/CT with [99mTc]Tc-MDP WBS, SPECT and SPECT/CT: p-values for the McNemar test (proportions) and DeLong test (AUC).
Figure 3. ROC curve of Na[18F]F PET/CT, [99mTc]Tc-MDP WBS, SPECT, and SPECT/CT using a patient and lesion-based optimistic and pessimistic analysis.
![Figure 3. ROC curve of Na[18F]F PET/CT, [99mTc]Tc-MDP WBS, SPECT, and SPECT/CT using a patient and lesion-based optimistic and pessimistic analysis.](/cms/asset/b79bd21e-1c91-496f-9ff1-358226d57bdd/ionc_a_2101899_f0003_c.jpg)
Table 3. Patient and lesion-based ROC curve analysis of Na[18F]F-PET/CT, [99mTc]Tc-MDP WBS, SPECT and SPECT/CT.
Supplemental material