
Figures & data
Figure 1. The flow chart.
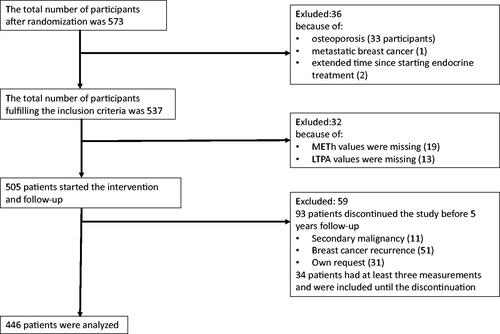
Table 1. Patient characteristics.
Table 2. Univariate and multivariate linear regressions models of physical activity (METh/week) at baseline.
Figure 2. Physical activity (METh/week, mean ± 95% confidence intervals) during the 5-year follow-up according to pretreatment LTPA level. The significance of LTPA, follow-up time and their interaction were tested in a generalizing estimating equations model with unstructured correlation structure.
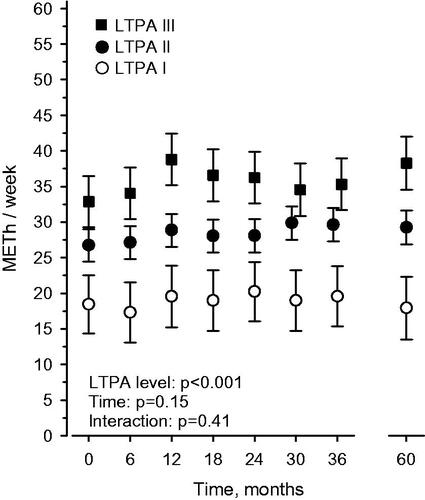
Table 3. Univariate and multivariate linear regression models for change in physical activity during 5-year follow-up (MET AUC6-60 minus baseline).
Supplemental material