
Figures & data
Table 1. Patient characteristics, QoL questionnaire results and parotid gland volumes.
Figure 1. Linear regression showing change in PG volume from baseline to mid-treatment as a function of the planned mean dose to the contralateral parotid gland (a) and ipsilateral parotid gland (b). The corresponding regression lines are shown with accompanying 95% confidence intervals.
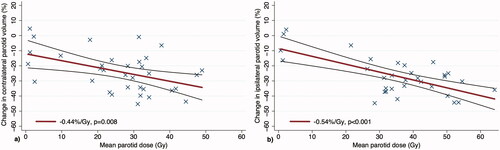
Figure 2. Scatter plot comparing the mean dose to contralateral parotid vs. mean dose to contralateral parotid SC PRV, based on planned dose from pre-treatment CT. The red circles represent patients who reported severe dry mouth (QoL score 3 or 4), and the black squares represent patients who did not (QoL score 1 or 2).
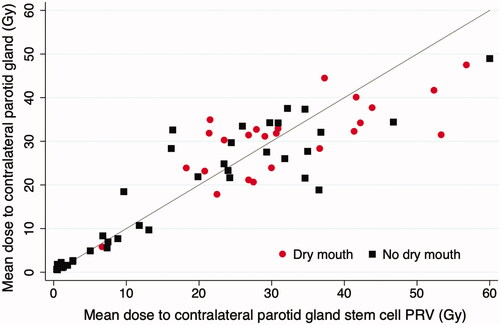
Figure 3. Logistic dose-response models estimating the risk of severe xerostomia as a function of mean dose to contralateral PG (a) and mean dose to the contralateral PGSC PRV (b), based on planned dose from pre-treatment CT. Patients were binned into four groups by mean dose: <10 Gy, 10–25 Gy, 25–35 Gy, and >35 Gy. Uncertainty bars represent 95% confidence intervals of xerostomia risk (vertical) and mean dose (horizontal) for each bin.
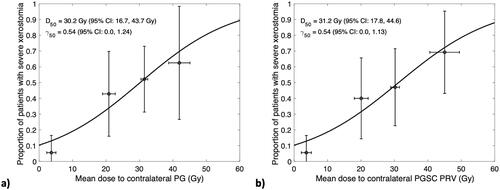
Table 2. Univariable logistic regression models of patient-reported severe xerostomia.
Supplemental Material
Download MS Word (4.5 MB)Data availability statement
The datasets generated during and/or analysed during the current study can be made available from the corresponding author on reasonable request.