
Figures & data
Table 1. Average population count, number (N) of PCa cases and deaths and age-standardized incidence and mortality rate by calendar period, university hospital region and municipality urbanization, education, and income level.
Figure 1. Age-standardized PCa incidence (blue) and mortality (violet) per 100,000 person-years in 5-years period from 1985–1989 to 2015–2019 by hospital district (circle) and municipality (dot).
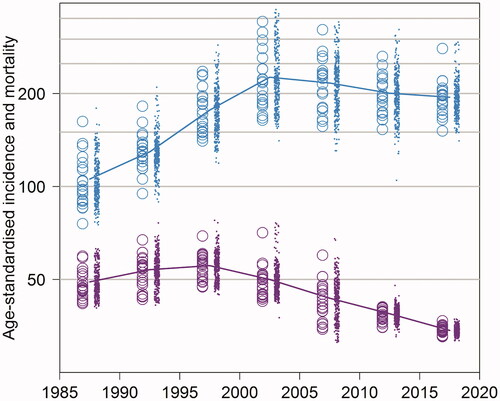
Figure 2. Age-standardized PCa incidence (blue) and mortality (violet) per 100,000 person-years in 5-years period from 1985–1989 to 2015–2019 by age group (0–69 years with dashed and 70+ years with solid line for the average rate), hospital district (circle), and municipality (dot).
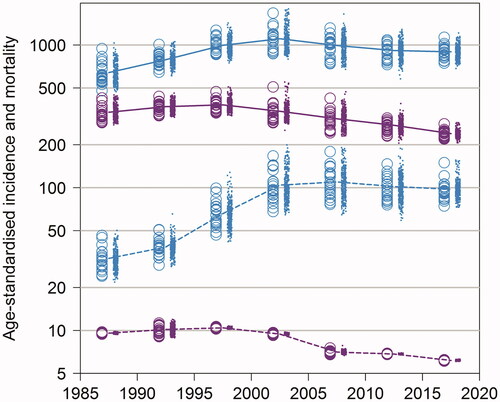
Table 2. SD of age-standardized PCa incidence and mortality (per 100,000 person-years) between hospital districts (Between), within hospital districts (Within), and between all municipalities (Total) by calendar period.
Table 3. Age adjusted rate ratios of level of municipality urbanization, education and income in PCa incidence, and mortality by calendar period.
Supplemental Material
Download MS Word (24.9 KB)Supplemental Material
Download MS Word (19.5 KB)Supplemental Material
Download MS Word (3.9 MB)Data availability statement
The data that support the findings of this study are available from the corresponding author, [HS], upon reasonable request.