
Figures & data
Figure 1. Flow diagram depicting the population screened for study enrollment, reasons for exclusion and the final study population.
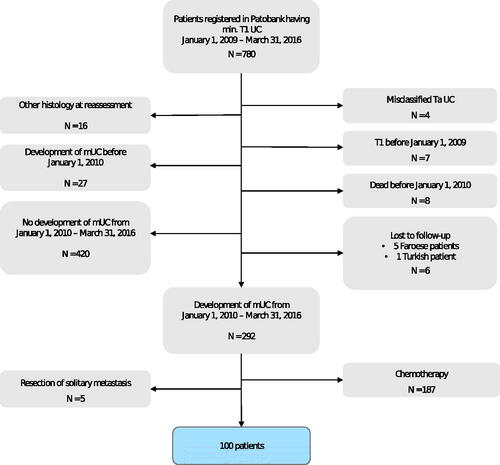
Table 1. Baseline characteristics of 100 patients diagnosed with mUC at Rigshospitalet, Denmark in the period 1 January 2010 to 31 March 2016, who did not receive systemic anticancer treatment and of 952 patients with locally advanced, unresectable or metastatic urothelial tract cancer of different histologic subtypes who received SAT in Denmark during the same inclusion period.
Table 2. Reasons for lack of chemotherapy as indicated in the electronic medical records of 100 patients with mUC not receiving systemic anticancer treatment.
Figure 2. Survival curve from diagnosis of mUC to death in 100 patients with mUC not receiving systemic anticancer treatment.
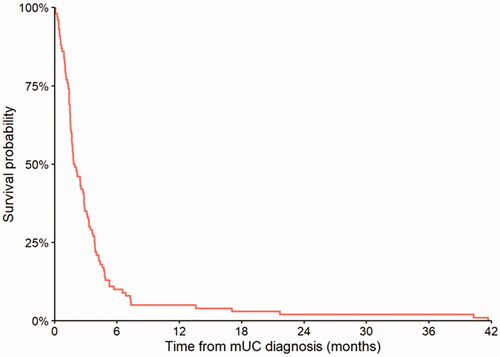
Table 3. Median OS plus 3-, 6- and 12-months OS rates in 100 patients with mUC not receiving systemic anticancer treatment and median OS in 952 patients with locally advanced, unresectable or metastatic urothelial tract cancer of different histologic subtypes who received SAT in Denmark during the same inclusion period.
Data availability statement
Data can be provided, except for personally identifiable information.