
Figures & data
Table 1. Summary of demographic, clinicopathologic, and 1 L treatment characteristics overall and by RCC histology subtype.
Table 2. Association of clinical outcomes with PD-L1 by immunohistochemistry and angiogenesis gene signature for patients with clear-cell histology (N = 227) and non-clear cell histology (N = 42) adjusted for age, IMDC, and other significant baseline covariates.
Figure 1. Moderate-strong (rho ≥ 0.4) biomarker correlations. mMDSC: monocytic myeloid derived suppressor cells; gMDSC: granulocytic myeloid derived suppressor cell; PD-L: programmed ligand death; IHC: immunohistochemistry; CPS: combined positive score; mRNA: messenger RNA; HIF: hypoxia inducible factor; TGF-β: transforming growth factor-β; EMT: epithelial-mesenchymal transition; GEP: gene expression profile.
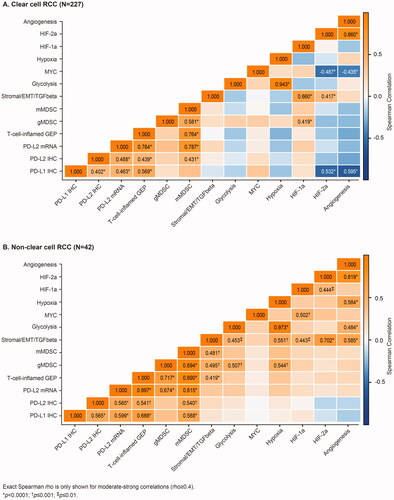
Figure 2. Progression-free survival and overall survival for patients with clear cell RCC and non-clear cell RCC histology, by PD-L1 CPS expression.
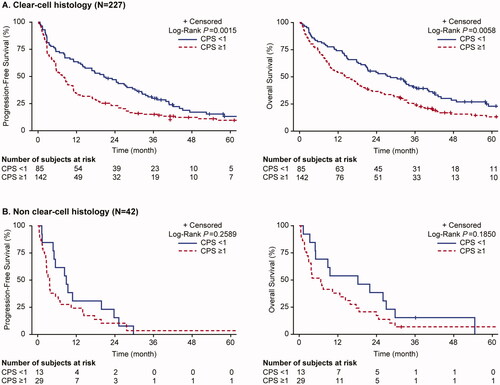
Figure 3. Progression-free survival and overall survival for patients with clear cell RCC and non-clear cell RCC histology, by angiogenesis expression.
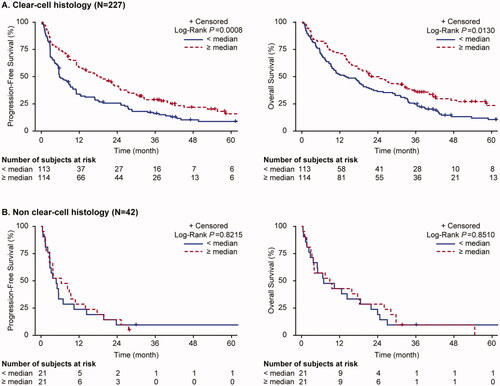
Table 3. Association of PD-L2 and gene expression profiles for patients with clear-cell histology (N = 227) and non-clear cell histology (n = 42) adjusted for age, IMDC, TcellinfGEP and other significant baseline covariates.