
Figures & data
Table 1. Total costs of cancer care, individual cost drivers, costs per population and per incidence, and share of total healthcare expenditure in 2017.
Figure 1. (A) Development of costs of cancer care in real terms between 2012 and 2017 (indexed, 2012 = 100) and (b) development of cancer care costs per incidence (=number of new cancer patients each year), in real terms (indexed, 2012 = 100).
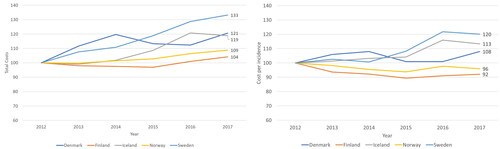
Figure 2. Development of individual cost drivers in real terms in each country between 2012 and 2017 (indexed, 2012 = 100).
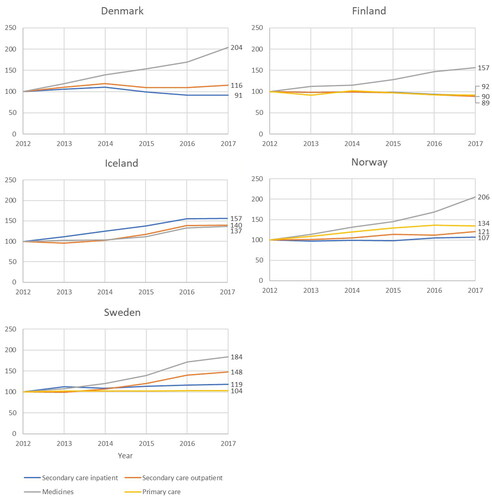
Figure 3. Development of secondary care inpatient days and inpatient days per incidence (=number of new cancer patients each year), between in each country 2012 and 2017 (indexed, 2012 = 100).
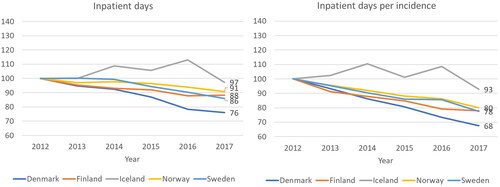
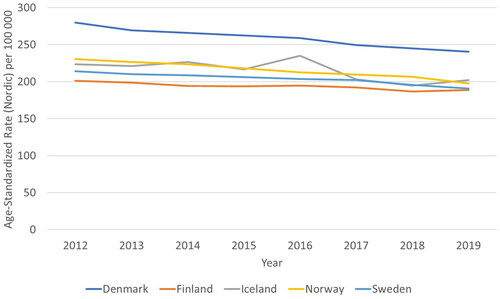
Figure 4. Development of age-standardized cancer mortality rate in each country (deaths per 100,000 inhabitants) between 2012 and 2019.
Supplemental Material
Download MS Word (16.1 KB)Data availability statement
The data are available upon request from the corresponding author