
Figures & data
Figure 1. (A) Development of CT thorax per 1000 inhabitants 2013–2020. (B) Fraction of stage IA lung cancer 2013–2020.
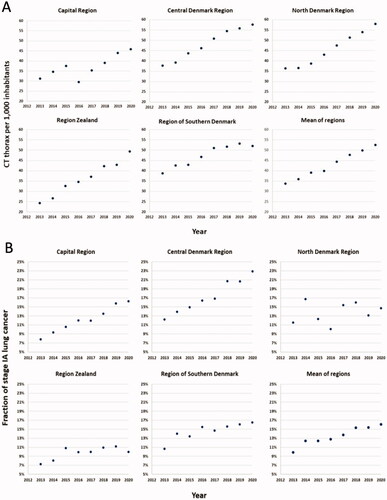
Figure 2. Correlation of CT thorax per 1000 inhabitants and fraction of stage IA lung cancer.
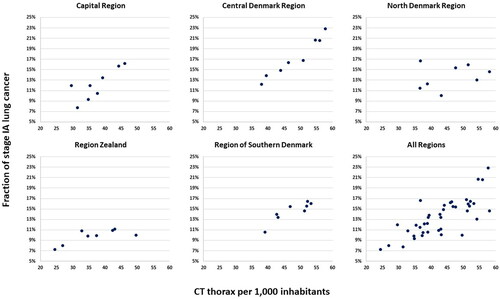
Figure 3. Clinical audit of stage IV lung cancer patients. CT abd: Computed tomography abdomen; CT TAP: Computed tomography thorax–abdomen–pelvis.
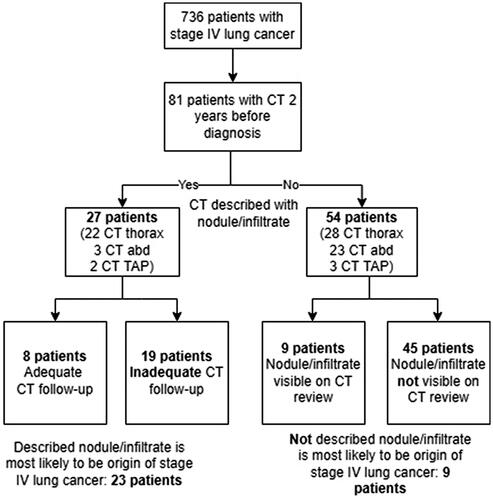
Figure 4. Example of infiltrate in right upper lobe that did not receive follow-up. Computed tomography examinations taken 10 months apart. Diagnosed with T4N2M1c small cell carcinoma.
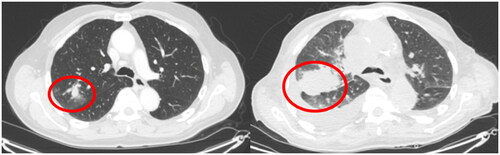
Table 1. Characteristics of nodules/infiltrates that did not receive follow-up.
Data availability statement
Data on CT examinations in Denmark and lung cancer stage distribution are publicly available. Clinical audit data will be made available upon request and after approval of the hospital directors.