
Figures & data
Figure 1. TMEM27 immunohistochemistry staining intensities starting from weak to strong membranous positivity (A-F). (A) shows the weakest staining (0.5) while (F) has the strongest membrane staining (3). Each image is at 40X. Scale bar represents 50 µM.
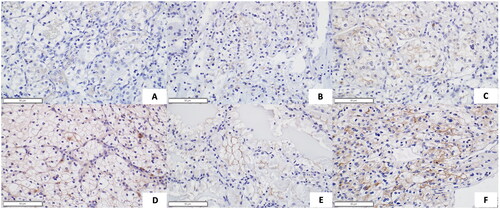
Figure 2. (A) Kaplan–Meier analysis demonstrating the association of TMEM27 IHC staining intensity with overall survival of 321 patients from time of nephrectomy. No stain is tumor that has 0 stain for TMEM27. Positive stain includes tumors with staining intensity from 0.5 to 3.0. The shaded areas around the lines represent the 95% confidence band. (B) Kaplan–Meier analysis demonstrating the association of TMEM27 IHC with disease-free survival in patients without metastasis at time of nephrectomy (N = 285). No stain is tumor that has 0 stain for TMEM27. Positive stain includes tumors with staining intensity from 0.5 to 3.0. The shaded areas around the lines represent the 95% confidence band.
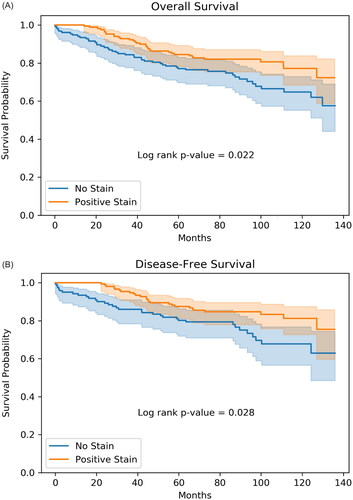
Table 1. Patient demographics based on intensity of TMEM27 immunohistochemistry staining.
Table 2. Correlation between TMEM27 staining and clinical characteristics.
Data availability statement
The data that support the findings of this study are available from the corresponding author, [RG], upon reasonable request.