
Figures & data
Table 1. Baseline characteristics of 69 included testicular cancer survivors.
Figure 1. Mean scores with 95% confidence intervals of whole-body bone mass density (BMD), lumbar spine BMD and left femoral neck BMD at baseline, 6 months, 12 months, and 3 months post-treatment (15 months). Purple lines represent mean values for patients treated with placebo and orange lines represent patients treated with testosterone. BMD is presented as total BMD (g/cm2) and T-score.
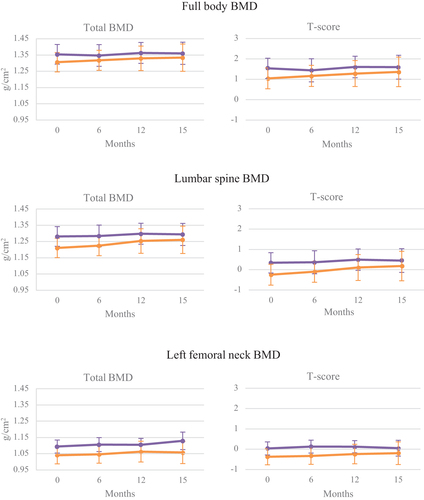
Table 2. Mean difference in outcomes between patients treated with testosterone and patients treated with placebo during treatment (6 and 12 months) and 3 months post-treatment (15 months). The difference in changes between groups is reported with 95% confidence intervals and was estimated with a linear mixed effects model. CTX-1: C-terminal telopeptides of Type I collagen. PINP: Procollagen Type I N-Terminal Peptide.
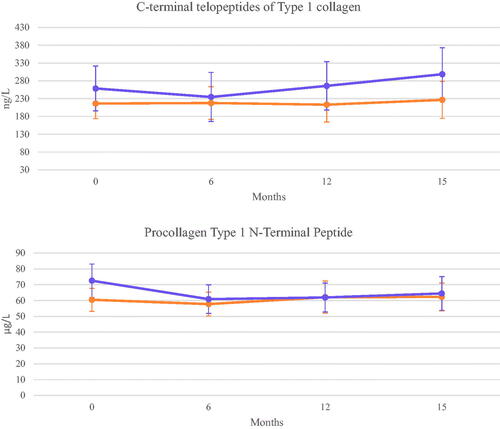
Figure 2. Mean scores with 95% confidence intervals of C-terminal telopeptides of Type 1 collagen (CTX-1) and Procollagen Type 1 N-Terminal Peptide (P1NP) at baseline, 6 months, 12 months, and 3 months post-treatment (15 months). Purple lines represent mean values for patients treated with placebo and orange lines represent patients treated with testosterone.
Data availability statement
According to Danish law individual patient data that underlie the results reported in this paper cannot be shared. Anonymized access to data might be possible, please contact the corresponding author regarding this. Study protocol can be shared upon request.