
Figures & data
Table 1. Initial patients characteristics.
Figure 1. Overall survival. (A) Overall survival for patients receiving locoregional plus systemic therapy versus systemic therapy. (B) Overall survival for patients receiving systemic therapy plus locoregional radiotherapy with a dose equal to 70 Gy versus a dose inferior to 70 Gy versus systemic therapy alone.
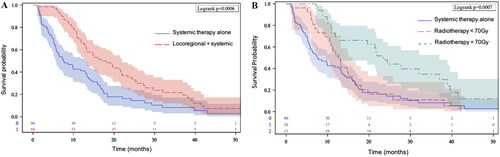
Figure 2. Progression free survival. (A) Progression free survival for patients receiving locoregional plus systemic therapy versus systemic therapy. (B) Progression free survival for patients receiving systemic therapy plus locoregional radiotherapy with a dose equal to 70 Gy versus a dose inferior to 70 Gy versus systemic therapy alone.
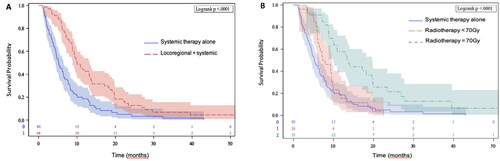
Table 2. Univariate and multivariate analysis for overall survival in entire cohort (n = 148).
Table 3. Univariate and multivariate analysis for overall survival in patients with partial, complete or stable metastatic response (n = 75).
Supplemental Material
Download MS Word (27.3 KB)Data availability statement
The authors confirm that the data supporting the findings of this study are available within the article and its supplementary materials.