
Figures & data
Table 1. Comparison between the cohorts in terms of the distribution of the prognostic factors of lung cancer (N = 3041).
Figure 1. Annual incidence and all-cause 5-year mortality rates (per 100,000) of lung cancer. n = annual number of new lung cancer patients. *Follow-up time is less than 5 years.
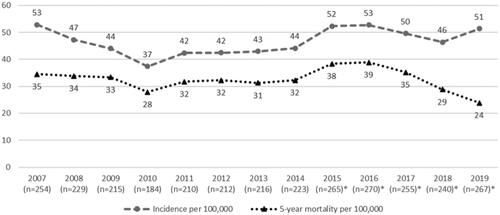
Figure 2. Kaplan–Meier’s curves for overall survival in both subcohorts.
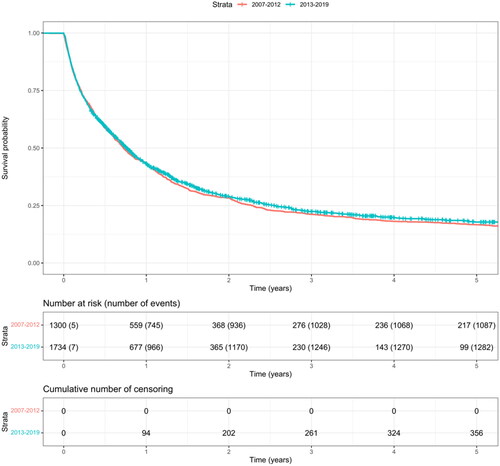
Table 2. The effects of prognostic factors on the risk of death (all causes): results of the multivariable-adjusted Cox regression analysis.
Supplemental material
Supplemental Material
Download MS Word (19 KB)Supplemental Material
Download EPS Image (14.8 KB)Supplemental Material
Download MS Word (22.6 KB)Data availability statement
The data that support the findings of this study are available from the corresponding author (JA) upon reasonable request.