
Figures & data
Figure 1. Consort diagram for the study cohort.
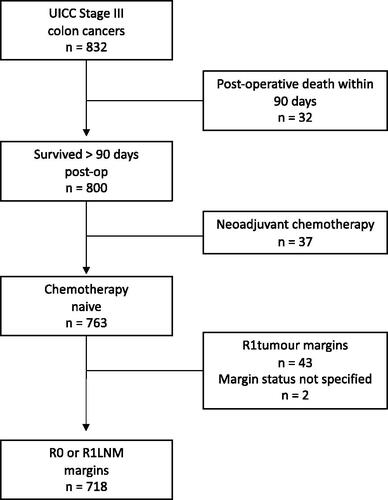
Table 1. Clinicopathological characteristics of the patient cohort.
Table 2. Pattern of adjuvant/post-operative chemotherapy.
Figure 2. 3-year oncological outcomes in patients with Stage III colon cancer stratified according to margin status (R0 = red, R1LNM = blue). (A) Local recurrence-free survival - R0 95.4% (93.2–96.9) versus R1LNM 97.8% (91.5–99.4), p = 0.336 (B) Distant metastases-free survival - R0 78.2% (74.5–81.3) versus R1LNM 58.8% (47.2-68.6), p < 0.001. (C) Disease-specific survival - R0 88.3% (85.2–90.9) versus R1LNM 78.5% (68.0–85.8), p < 0.001.
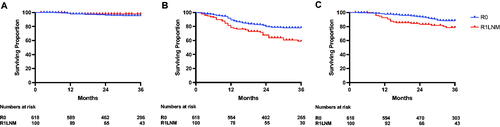
Figure 3. The impact of margin status on oncological outcomes according to perceived risk of relapse in patients with Stage III colon cancer.
Distant-metastases-free survival in (A) low-risk patients (R0 86.4% (82.1–89.8) versus R1LNM 60.1% (31.3–80.0), p = 0.014) and (B) high-risk patients (R0 68.6% (62.5–73.8) versus R1LNM 58.0% (45.1–68.9), p = 0.358). Disease-specific survival in (C) low-risk patients (R0 97.4% (94.5–98.8) versus R1LNM 86.4% (63.4–95.4), p < 0.001) and (D) high-risk patients (R0 78.1% (72.2–82.9) versus R1LNM 76.6% (64.4–85.1), p = 0.452). Low risk was defined as T1-3 and N1 disease. High risk was defined as T4 or N2 disease.
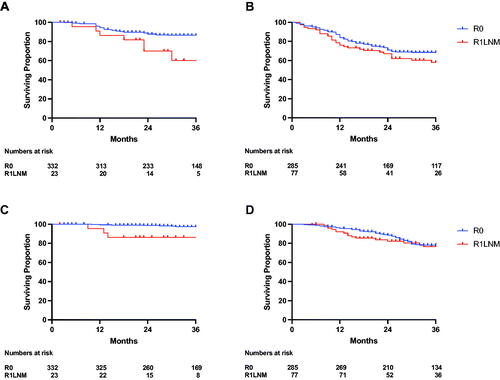
Figure 4. Oncological outcomes in patients with Stage III colon cancer who completed 6 months chemotherapy. (A) Distant-metastases-free (R0 79.4% (72.8–84.5) versus R1LNM 53.7% (36.0–68.5), p = 0.003). (B) Disease-specific survival (R0 92.1% (86.8–95.4) versus R1LNM 81.3% (64.4–90.7), p = 0.016).
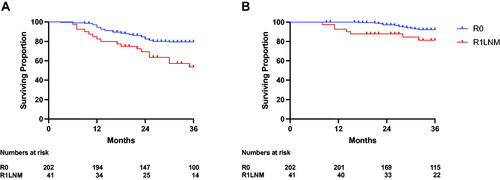
Table 3. Multivariable analyses of factors associated with DMFS and DSS in patients receiving chemotherapy following potentially curative surgery for Stage III colon cancer.
Supplemental Material
Download MS Word (14.7 KB)Supplemental Material
Download MS Word (11.7 KB)Supplemental Material
Download PDF (31.4 KB)Data availability statement
In accordance with Danish law, the data on which the findings of this study are based cannot be made available for sharing.