
Figures & data
Table 1. Patient data.
Figure 1. (a) Isodose for a typical bilateral HN patient. (b) DVH for all 3 CTVs of the HN patient. (c) Isodose on a robustness evaluation scenario. (d.1) DVH of the CTVs for the nominal plan (dashed) and the robustness scenario (solid). (d.2) Tail of the CTV DVH. Mean max dose is calculated from the tail of the DVH. (e) Hotspot and dose heterogeneity from the 330° right posterior oblique (RPO) beam. (f) DVH for all 3 CTVs from the RPO beam. Notes: There is a > 5% max dose change in (d). this is shown in the isodose with the pink hotspots in (c). Figure (e)’s white hotspot represents a 110% beam dose heterogeneity.
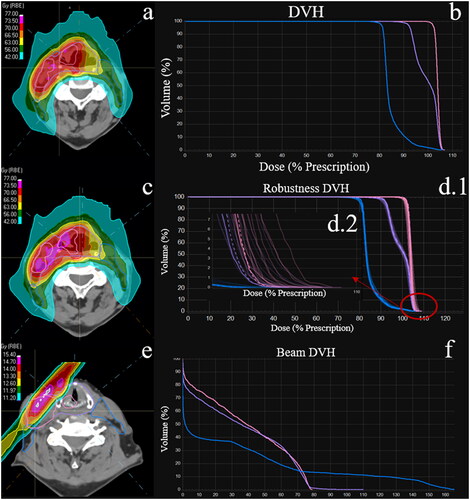
Figure 2. Multilayer perceptron neural network for re-plan prediction. BHI: beam heterogeneity index, postop: whether the patient had surgery, dmax variation: max dose change across robustness scenarios, chemo: whether the patient is undergoing chemotherapy, h: hidden unit.
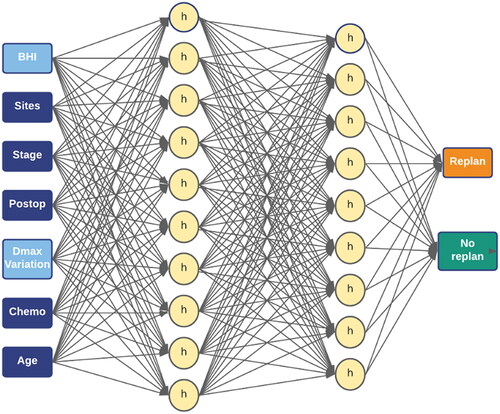
Figure 3. (a) Distributions of mean beam heterogeneity index (BHI) and success rate. (b) Distributions of mean V100 and max dose change. (c) Normalized importance for all features used in the prediction model. (d) ROC curve for the prediction model. The area under the curve (AUC) is .855.
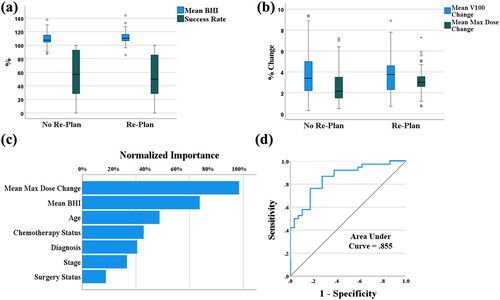
Table 2. Results for numerical features.
Supplemental Material
Download MS Word (36.8 KB)Data sharing
Due to ethical/legal/commercial reasons, supporting data is not available.
Data availability statement
Research data are not available at this time.