
Figures & data
Table 1. Baseline characteristics.
Table 2. Therapy regimen in each line.
Figure 1. Overall survival for all patients and according to subgroups. Adherence to guidelines analyzed as a time dependent variable. CNS metastases according to presence at index. Median overall survival (mOS) and log-rank test are shown together with patients at risk according to different time-point.
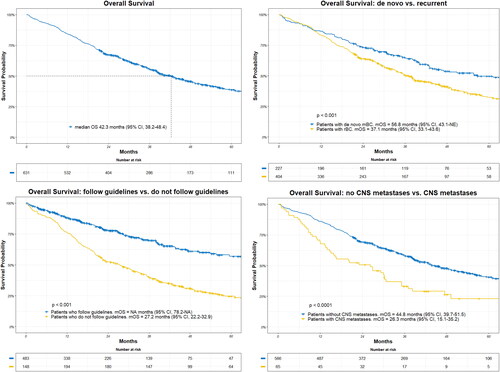
Figure 2. Cumulative incidence of brain metastases and death as competing event according to time since index. Patients at risk according to different time-point are listed below the x-axis.
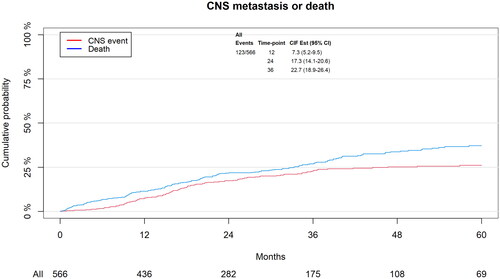
Table 3. Fine and Gray sub-distributional proportional hazard models for risk of developing brain metastases.
Supplemental Material
Download MS Word (11.6 KB)Supplemental Material
Download TIFF Image (15.4 MB)Supplemental Material
Download TIFF Image (15.4 MB)Data availability statement
The data supporting the findings of this study are not publicly available due to institutional restrictions. The data can be made available to qualified researchers through application to the Danish Breast Cancer Group.