
Figures & data
Figure 1. Tumour response to calcium electroporation and pembrolizumab. (A1) Clinical photograph of the left inguinal region prior to initial instatement of CaEP, showing clinical progression of recurring inguinal lymph node metastasis during first bout of pembrolizumab. (A2) Contrast-enhanced CT-scan axial view at the level of the left inguinal region, performed at approximately the same time as the clinical photograph in A1, confirming progression of lymph node metastasis. (B1) Clinical photograph of the left inguinal region following four treatments of local calcium electroporation and second bout of pembrolizumab, showing complete clinical response. (B2) Contrast-enhanced CT-scan axial view at the level of left inguinal region, performed at approximately the same time as the clinical photograph in B1, showing regression of both the exophytic and deeper seated parts of the lymph node metastases.
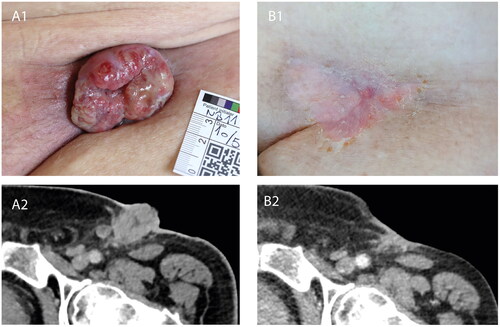
Figure 2. Overview of patient treatments.
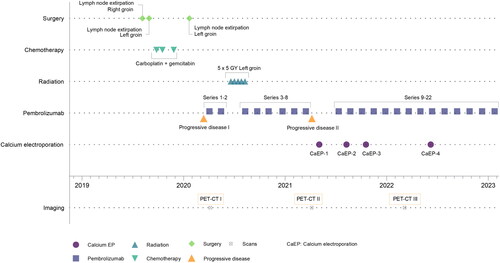
Figure 3. Illustration of electroporation treatment of superficial inguinal tumour. Electroporation is conducted subsequently after calcium injection of the tumour and margin area. The electrode, at full length (3 cm), cannot reach the most profound parts of the tumour. Caution is required during treatment due to the anatomical structures, e.g. the femoral vein, nerve, and artery, adjacent to the tumour tissue. Note: Exaggerated dimensions, features and anatomical structures for illustration purposes in this image, which is not an exact representation of the patient.
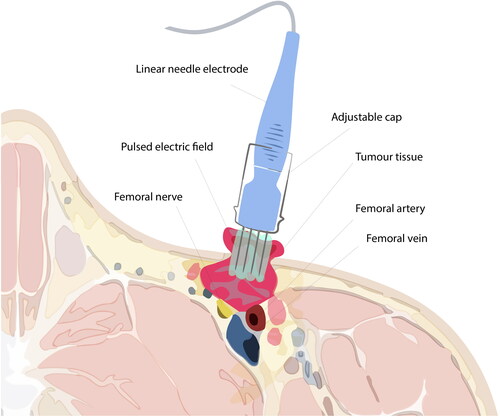
Figure 4. PD-L1 expression, necrosis and inflammation. (A) Day 0, baseline before first CaEP treatment. A1 shows carcinoma with necrosis and inflammation. (B) Day 2, after one CaEP treatment. B1 shows necrosis and inflammation. (C) Day 90, before second CaEP treatment. C1 shows pronounced inflammation and no necrosis. C2 shows PD-L1 expression of tumour tissue. (D) Day 240, before third CaEP treatment. D1 shows a biopsy from a recurrence with low inflammation of tumour tissue and no PD-L1 expression. (E) Biopsy from clinical complete response two months after fourth CaEP treatmen. E shows inflammation and fibrosis and no residual tumour.
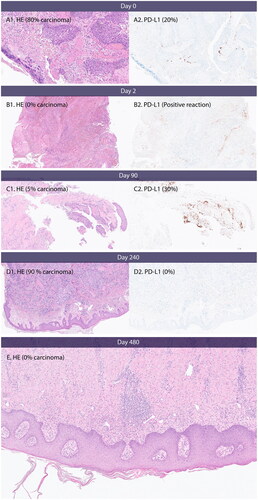
Table 1. Cellular effects in biopsies taken before and after treatment with calcium EP.
Supplemental Material
Download MS Word (12.2 KB)Supplemental Material
Download JPEG Image (10 MB)
Supplemental Material
Download JPEG Image (3.9 MB)
Data availability statement
De-identified participant data are available from the corresponding author upon reasonable request. Reuse of data requires approval from the pertinent ethics committee.