
Figures & data
Table 1. Planning objectives for h-IMRT and h-ARC optimization.
Table 2. Dosimetric parameters comparison between 3D-CRT and hybrid (h-IMRT, h-ARC) techniques.
Figure 1. The average cumulative dose-volume histograms. Comparison of PTV (a), heart and LAD (b), contralateral breast (c), and ipsilateral and contralateral lungs (d) between 3D-CRT, h-ARC and h-IMRT plans.
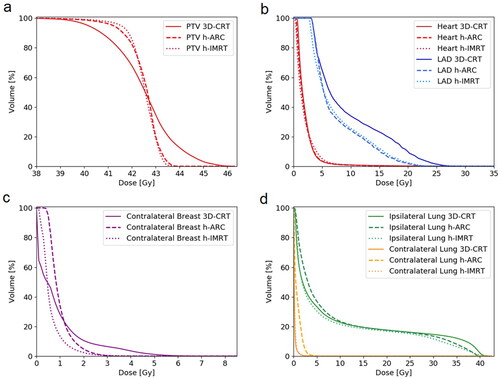
Figure 2. Comparison of isodose distributions between three-dimensional conformal radiotherapy (3D-CRT), hybrid intensity-modulated radiotherapy (h-IMRT) and hybrid volumetric-modulated arc therapy (h-ARC). The color-wash thresholds are: 3, 5, and 40.375 Gy, which is 95% of the prescribed dose.
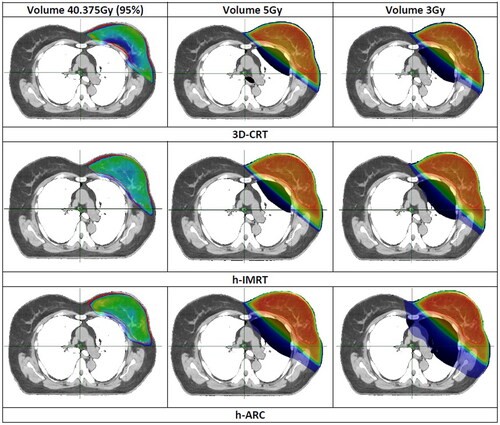
Table 3. Comparison of OED for left lung, right lung and right breast.
Figure 3. Relative risks ratios of secondary cancer based on the full mechanistic dose-response model for left lung, right lung and right breast, for each patient.
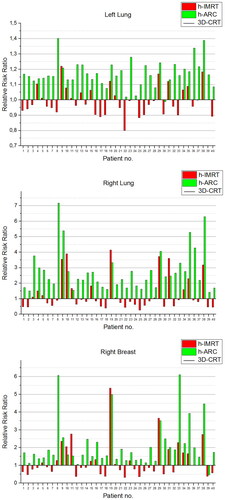
Table 4. Relative risk ratios for secondary carcinomas (left lung, right lung, right breast) assessed using the Schneider’s models.