
Figures & data
Figure 1. (A) patient outcomes according to treatment modality (B) extremity patients outcomes according to treatment modality.
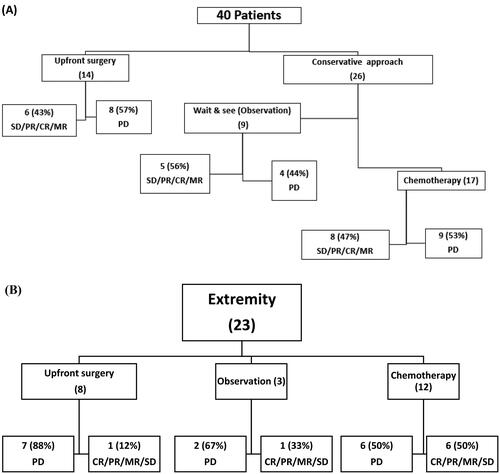
Table 1. Differentially expressed miRNAs among unsupervised analysis (G1 and G2) and among supervised analysis (observation and extremity groups).
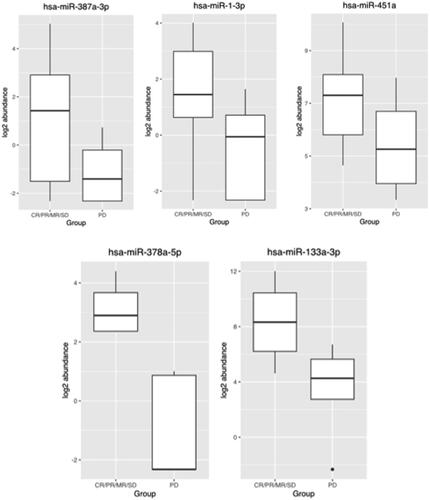
Figure 2. Box plot for the actual expression level for the five recommended miRNAs.
Supplemental material
Supplemental Material
Download MS Word (382.9 KB)Supplemental Material
Download MS Word (34.9 KB)Data availability statement
Data used to support the findings of this study are available from the corresponding author upon request.