
Figures & data
Figure 1. Statin exposure categorizations evaluated in the study analyses.
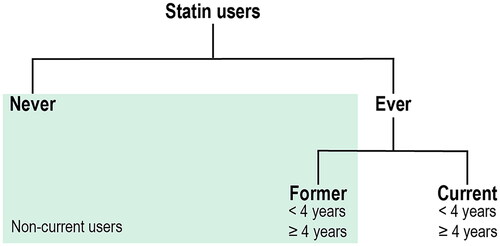
Table 1. Age-adjusted characteristics of the study populations by ever statin use in 2000 (HPFS, NHS) and 1999 (NHS II).
Table 2. Hazard ratios, and 95% confidence intervals for renal cell carcinoma (RCC) risk according to statin use in the HPFS (1990–2016), NHS (1994–2016), NHS II (1999–2015) cohorts.
Supplemental material