
Figures & data
Figure 1. Illustration of the process for identifying the relapse point of origin (PO), defined as the center of volume: (a) RT target volume contours displayed on the planning CT: GTV-PET (cyan), GTV (red), CTV1 and CTV3 (pink), (b) T-site relapse volume (RV, purple contour) delineated on relapse scan, (c) relapse scan and RV deformed to the anatomy of the planning CT, and (d) the deformed relapse volume and corresponding PO (turquoise cross) copied onto the planning scan. As shown in (d), the point of origin for this relapse was inside GTV-PET.
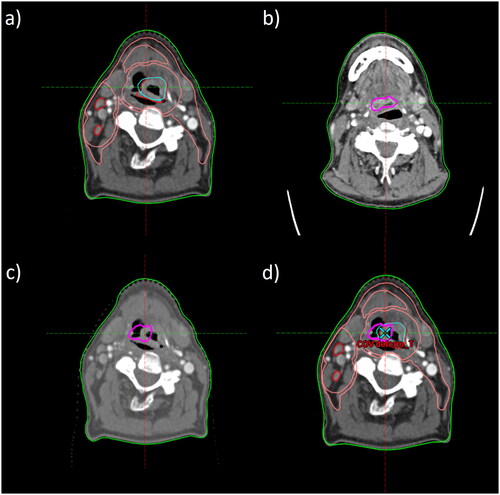
Figure 2. Patient inclusion flowchart for relapse pattern analysis.
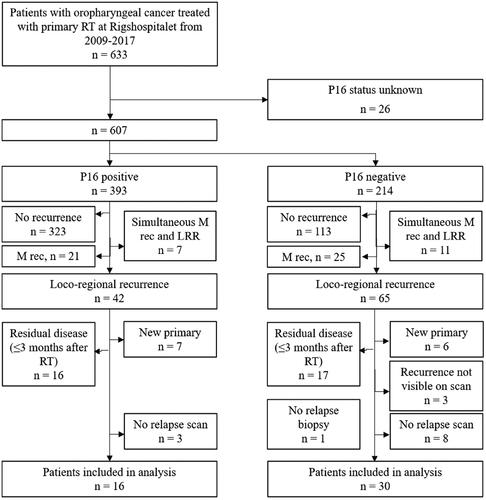
Table 1. Patient characteristics of the HPV positive and negative OPSCC patients (n = 16 and 30, respectively) included in the analysis, as well as of the whole OPSCC patient cohort (n = 633).
Figure 3. Relapses visualized for the OPSCC patients included in the analysis; grouped by HPV status, as well as all patients combined. Each dot represents the point of origin of a T-site (red) or N-site (black) relapse. The relative areas of the circles correspond to the mean volume of the target volumes among the patients analyzed. CTV2 was omitted from the figure (only available in 63% of patients and harboring no relapses). Note that the positions of the ‘recurrence dots’ were randomly positioned within each target area.
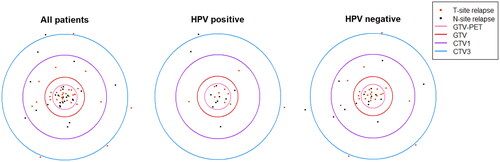
Figure 4. Distribution of relapse frequency [no. relapses] (a) and relapse density [no. relapses/cm3] (b) in the different RT target volumes.
![Figure 4. Distribution of relapse frequency [no. relapses] (a) and relapse density [no. relapses/cm3] (b) in the different RT target volumes.](/cms/asset/96ebc66e-9104-4e44-a8fe-6d39fbb77d58/ionc_a_2238889_f0004_b.jpg)
Table 2. Recurrence type and location for HPV +/− patients (frequency, percentage and 95% confidence interval).
Supplemental Material
Download MS Word (186.1 KB)Supplemental Material
Download MS Word (16.1 KB)Data availability statement
Data not available due to ethical/legal restrictions.