
Figures & data
Table 1. The clinicopathological variables, their median, range, and distribution.
Figure 1. Examples of the IHC scores of SSTR2. (A) Membranous score 4. (B) Cytoplasmic score 3. (C) Membranous score 2. (D) Cytoplasmic score 1.
The magnification images are taken with 40x times magnification. The main images were taken with 10x magnification. The scale bar represents 100 µm.
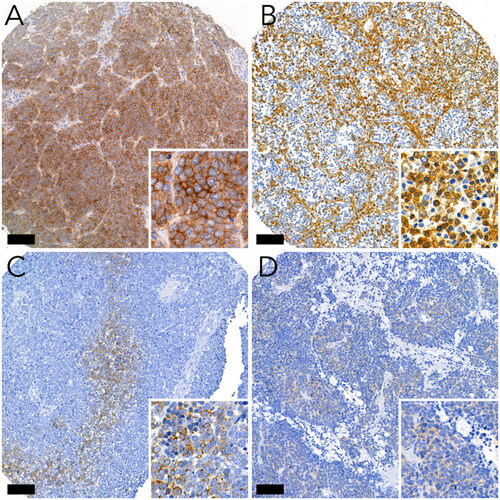
Figure 2. Explanation of the rules regarding over-all score.
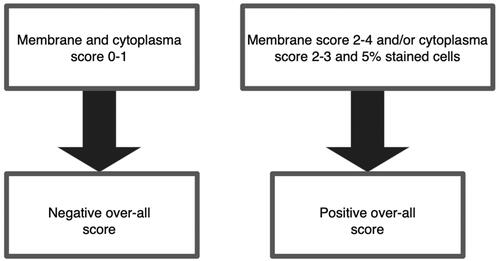
Figure 3. Distribution of cytoplasmic, membranous, and over-all SSTR2 expression.
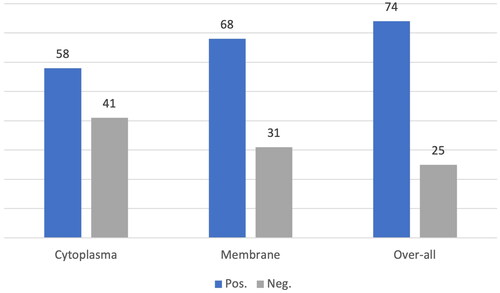
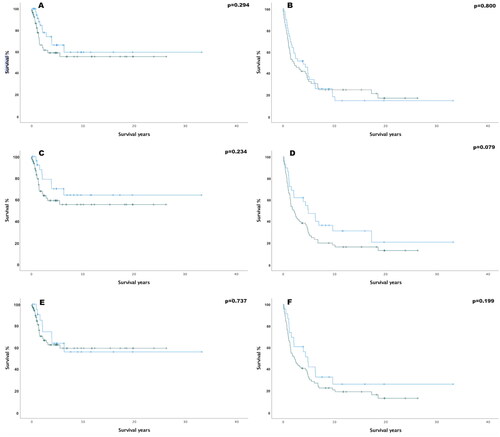
Figure 4. Kaplan–Meier curves of SSTR2 (five-year survival-%) (A) cytoplasmic disease specific survival (SSTR2 Pos. 59.2%, SSTR2 Neg. 66.4%, hazard ratio (HR)= 1.22, (95%-confidence interval (95%-CI) = 0.88–1.69). (B) Cytoplasmic overall survival (SSTR2 Pos. 34.2%, SSTR2 Neg. 37%, HR= 1.07 95%-CI= 0.86–1.32) (C) Membranous disease specific survival (SSTR2 Pos. 59.3%, SSTR2 Neg. 70.2%, HR= 1.62, 95%-CI= 0.73–3.64). (D) Membranous overall survival (SSTR2 Pos. 30.1%, SSTR2 Neg. 47.5%, HR= 1.58, 95%-CI 0.94–2.65). (E) Overall positivity disease specific survival (SSTR2 Pos. 62.5%, SSTR2 Neg. 63.9%, HR= 1.15, 95%-CI= 0.51–2.57). (F) Overall positivity in overall survival (SSTR2 Pos. 33.3%, SSTR2 Neg. 42.1%, HR= 1.43, 95%-CI= 0.82–2.50). In all the Kaplan–Meier plots, the blue graph represents negative SSTR2 expression survival rate and the green one represents positive expression survival rate.
Supplemental Material
Download MS Word (21.7 KB)Data availability statement
Due to the nature of the research, clinical data is not available. The original scores adjoined to the TMA is available at request.