
Figures & data
Figure 1. Proportions of caregivers with high caregiver burden (n = 184). Measured by caregiver reaction assessment (CRA), a lower score on the caregiver esteem subscale indicates a higher burden (<4 = high burden) and for the four other subscales a higher score indicates a higher burden (≥3 = high burden). Numbers included varies because of missing data (n = 183–184).
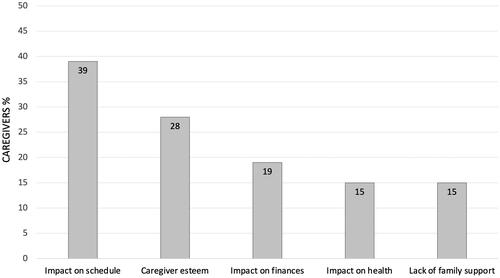
Figure 2. Proportions of caregivers reporting need of support (n = 182). Numbers included varies because of missing data (n = 178–182).
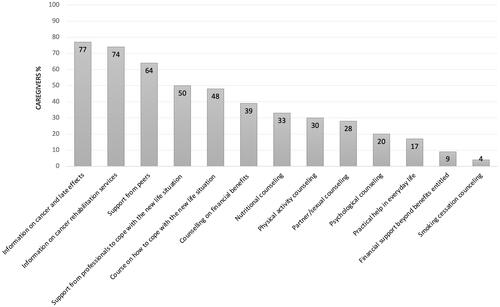
Table 1. Characteristics of the caregiver participants (n = 185).
Table 2. Level of caregiver burden (n = 184).
Table 3. Factors associated with level of caregiver burden in caregiver reaction assessment subscales in linear regression analyses.
Table 4. Factors associated with increasing need for information and support (range 0–13) in linear regression analyses.
Supplemental Material
Download MS Word (15.1 KB)Data availability statement
The data that support the findings of this study are available on request from the corresponding author. The data are not publicly available due to privacy and ethical restrictions.