
Figures & data
Figure 1. CONSORT Diagram.
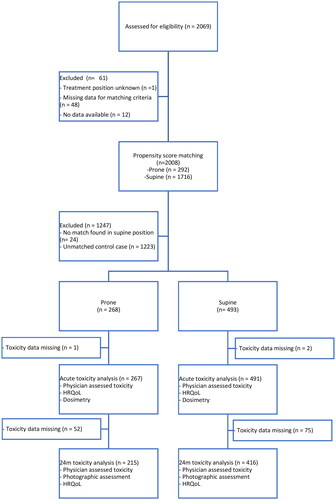
Table 1. Baseline characteristics of patients treated in prone and supine positions, before and after propensity score matching.
Figure 2. Comparison of physician-assessed toxicity between prone and supine positions. (A) Proportion of patients with a deterioration in toxicity at the end of radiotherapy compared to baseline with one category (oedema, ulceration and breast pain) or two categories for dermatatis. (B) Proportion of patients experiencing grade I or higher toxicity at 2 years after radiotherapy.
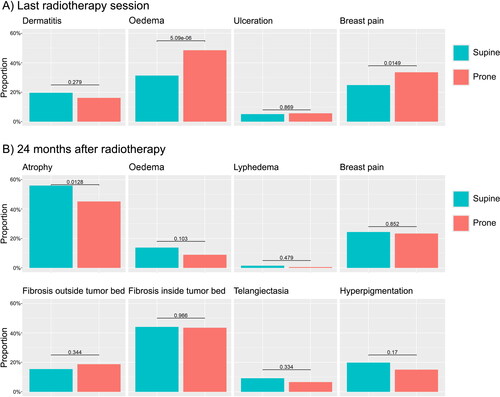
Table 2. Photographic assessment at 24 months of deterioration of cosmesis compared to baseline for the photographs with (A) both arms on the hips and (B) both arms elevated.
Figure 3. Proportion of patients, treated in prone or supine position, experiencing an improvement or deterioration of at least 10 points compared with baseline at (A) the end of radiotherapy and (B) 24 months after radiotherapy.
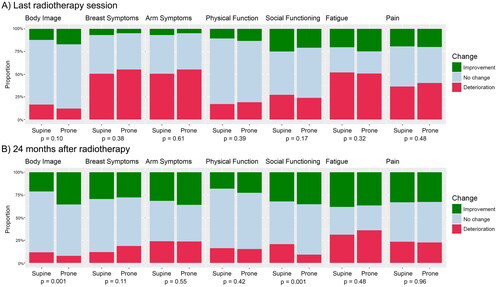
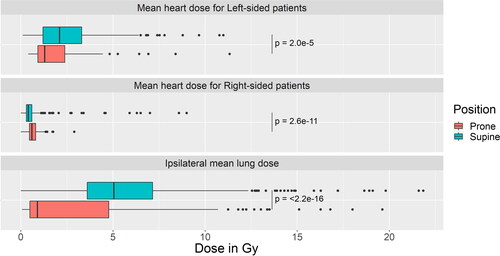
Figure 4. Mean heart dose, shown separately for left- and right-sided breast cancer patients, and ipsilateral mean lung dose for all patients.
Data availability statement
Raw data were generated by the REQUITE consortium. Derived data supporting the findings of this study are available from the corresponding author VV on request. External researchers can contact [email protected] for further information on how to apply for access to the full REQUITE data (fees apply).