
Figures & data
Figure 1. The pooled weighted rate of the ultimate local failure in the intention-to-treat analysis of all the patients starting radio(chemo)therapy (potential candidates for w&w).
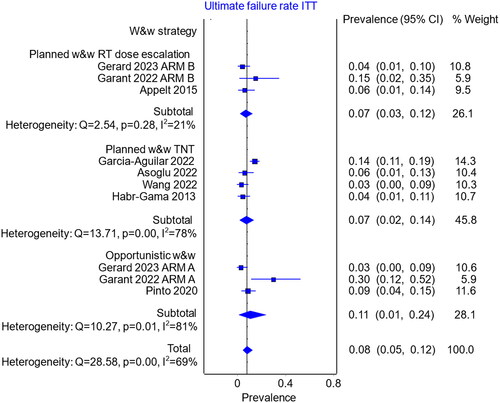
Table 1. Ultimate local failure among all the patients starting radio(chemo)therapy as potential candidates for w&w.
Figure 2. The pooled weighted rate of ultimate local failure among patients starting w&w.
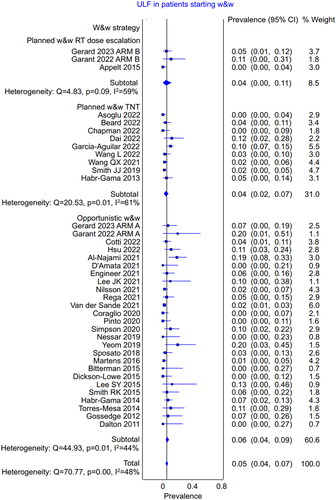
Table 2. Ultimate local failure among the patients starting w&w strategy.
Figure 3. The pooled weighted rate of ultimate local failure among patients with regrowth.
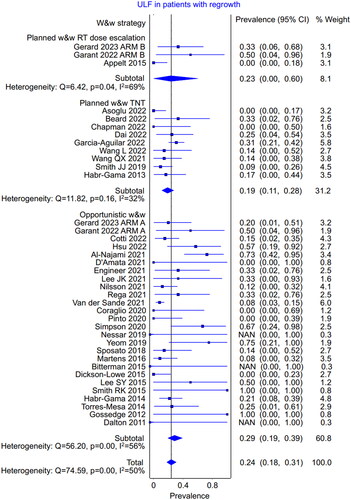
Table 3. Measures potentially leading to a reduction of regrowth risk in the watch-and-wait (w&w) strategy.
Supplemental Material
Download PDF (2.4 MB)Data availability statement
The authors confirm that the data supporting the findings of this study are available within the article and its supplementary materials.