
Figures & data
Table 1. Clinical characteristics of meningioma cases, Finland 1990–2017 (N = 9842).
Figure 1. Number of cases and incidence of meningiomas in Finland by 4-year period during 1990–2017 by sex.
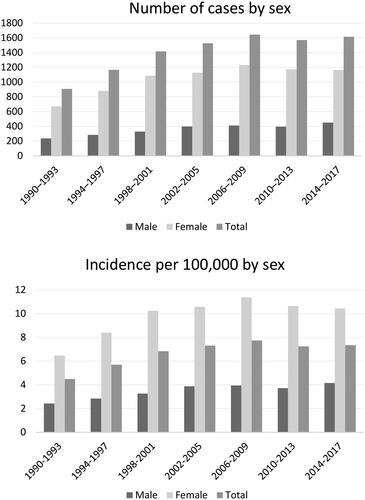
Figure 2. Incidence rate ratio of meningiomas by 10-year age group (with 95% confidence interval, ages 0–19 as the reference group), Finland 1990–2017.
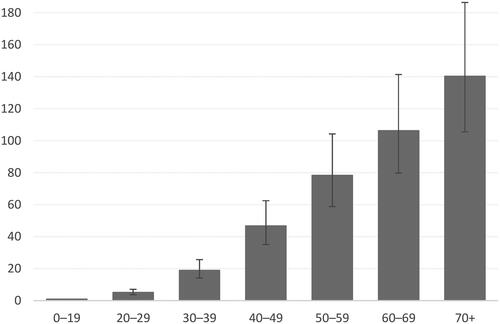
Figure 3. Annual age-standardized incidence rates per 100,000 by sex in Finland during 1990–2017 with 95% confidence intervals.
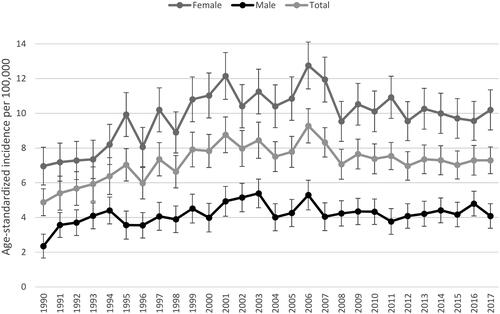
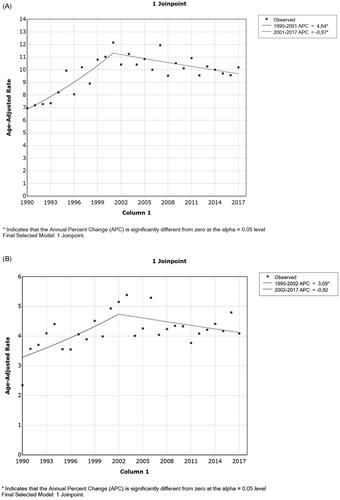
Figure 4. Joinpoint analyses of meningioma incidence rates in women (A) and men (B), Finland 1990–2017.
Data availability statement
The data (meningioma cases and incidence) are available from registry authorities, as according to Finnish regulations, researchers are not allowed to forward confidential non-anonymous health data to any third parties.