
Figures & data
Figure 1. PubMed Search results: ‘Adaptive radiotherapy head neck cancer’. English language filter was applied. Each column represents the number of published articles per year. Picture is captured from: https://pubmed.ncbi.nlm.nih.gov/. Modified using the windows office package.
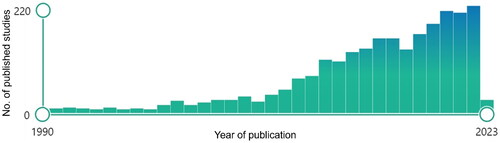
Figure 2. PRISMA diagram of study selection. Diagram made in https://lucidchart.com.
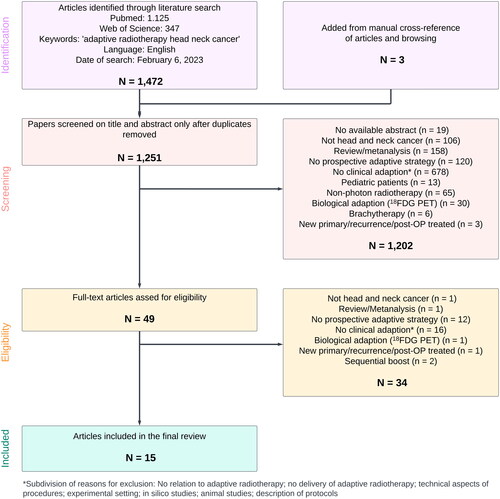
Table 1. Characteristics of studies included in the review.
Figure 3. The 392 patients treated with adaptive radiotherapy by year of publication. Each column represents the number of patients treated with ART in each study. Sections marked pink, blue and green represent the share of patients not analyzed, treated off protocol or treated with palliative intend respectively. Mean number of patients treated per study was 26, and the median was 20 (interquartile range: 15-30).
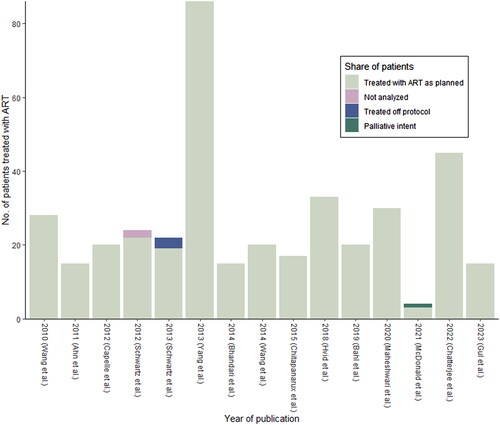
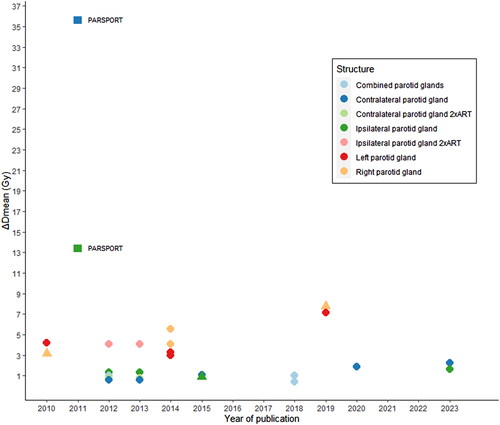
Figure 4. Reduction in mean dose to parotid glands by publication year. Circles represent significant results and triangles represent non-significant results of the reduction in mean dose with ART vs. non-ART. The squares represent the reduction in mean dose found in the PARSPORT trial with parotid sparring IMRT vs. 3D-RT.
Supplemental Material
Download MS Word (14.3 KB)Supplemental Material
Download MS Word (22.6 KB)Data availability statement
Data derived from public domain resources.